• Home
  • Company
    • What we did
    • The People
    • Press
    • Around Us
  • Approach
  • Products
    • Mutual Funds
      • Pharus Asian Value Niche
      • Safe Capital Electric Mobility Value Niche
      • NEF Ethical Global Trends
      • NEF Ethical Step to Balanced 2030
      • NJ Japanese Orphan Companies
      • NJ Korea Reunification
      • NJ Indonesian Infrastructure Small Caps
  • SDG
    • SDG in words
    • SDG in videos
    • Global Compact
    • Fairr
    • SDG Events
    • SDG Academy
    • SDG Analysis
  • NicheJungle
  • Contact Us
  • Newsletter
  • English
    • Italiano
    • English
  • Home
  • Company
    • What we did
    • The People
    • Press
    • Around Us
  • Approach
  • Products
    • Mutual Funds
      • Pharus Asian Value Niche
      • Safe Capital Electric Mobility Value Niche
      • NEF Ethical Global Trends
      • NEF Ethical Step to Balanced 2030
      • NJ Japanese Orphan Companies
      • NJ Korea Reunification
      • NJ Indonesian Infrastructure Small Caps
  • SDG
    • SDG in words
    • SDG in videos
    • Global Compact
    • Fairr
    • SDG Events
    • SDG Academy
    • SDG Analysis
  • NicheJungle
  • Contact Us
  • Newsletter
  • English
    • Italiano
    • English


  • Niche AM Newsletter

    • The Grey Discount — Chapter I
      September 2, 2026
    • No meat’s land
      July 15, 2026
    • When a bubble bursts, not everything bursts
      June 24, 2026
    • The ugly duckling of Asia
      June 3, 2026
    • Do Emerging Markets still provide diversification?
      May 19, 2026


02
Sep
2026
The Grey Discount — Chapter I
Posted On September 2, 2026  By admin  And has No Comment

Ageing is the most predictable trend in economics, yet nobody wants to own it

Ageing is the most predictable trend in economics. Everybody who will be eighty, eighty-five or ninety in 2050 has already been born. No adoption curve or technological breakthrough is required. At the same time better access to information and higher incomes mean that consumer tastes and needs are changing: people know more about their own health than any generation before them, earn more, and increasingly want to be tested — when their governments are not already telling them to — in order to catch and treat disease early, or simply to feel, and look, better. They are probably more narcissistic, more anxious and more ambitious: it has been argued that, having largely tamed famine, plague and war, humanity has set itself a new project, i.e. immortality.1

And yet, while these demand drivers are so predictable, the listed companies whose business is to look after those people and those needs — mainly nursing homes, clinics and diagnostic laboratories — sit among the cheapest corners of global equity markets, the United States aside.

The sector has been sold as “grey gold” several times, has bubbled several times, and has never fully delivered. Then came Covid, which created overcapacity in diagnostics and put care homes on the front pages for the worst possible reasons; and then the Orpea affair in France, which erased more than 95% of the value of Europe’s largest operator and tainted everything around it.

What is left is a group of businesses across nursing homes and diagnostics with recovering occupancy, capacity being closed or consolidated, rising testing and treatment volumes, a demographic driver about as predictable as anything in economics, and balance sheets often backed by real estate — priced as though the trend had been cancelled.
The market pays something close to forty times cash flow for the theme in the United States, when it arrives wrapped in a real estate investment trust.2 What it ignores is the price of ageing everywhere else. Throughout our funds we own several of those companies, valued on average, in the care, diagnostics and holistic care business, that make up the bulk of our holdings, below the value of their tangible assets and on a single digit P/E.

This is the first of three articles on the theme. It deals with nursing homes and senior living, which is where the scandal happened. The second will take up clinics and diagnostics, and the third holistic care (pharmaceuticals, nutrition and cosmetics).


Nursing Homes & Senior Living — The investment thesis in short

Predictable demand. Everyone who will be eighty in 2050 is already alive and counted. No adoption curve, no technology risk, no change in consumer taste is required. Demography is predetermined.

Constrained supply. Senior-housing construction has collapsed, while licensing takes years. Long admission queues and hard licences support occupancy and negotiating leverage, though regulated tariffs limit how fast scarcity becomes price.

A compulsory payer that pays private companies. Several countries now run mandatory long-term care insurance whose liabilities grow automatically with the age of the insured. In Germany private, for-profit, nursing homes represent about 40% of the market; in Korea commercial providers hold three-quarters of the market. The state is the customer, not the competitor.

Mispriced operator risk. The market pays close to forty times cash flow for operating exposure to ageing in the United States and under ten times earnings for the same operating exposure in Japan, Korea and Europe. Scale, liquidity and capital structure explain only part of that valuation gap. The rest is not justified.

Asset backing. Nursing homes often trade below the value of the buildings they own.

How we play it. We are not buying a longevity narrative in itself. We are deep-value investors: we buy cheap, profitable, asset-backed businesses — at multiples that reflect years of reputational damage rather than the quality of the underlying assets.

 

How a sector became uninvestable

In January 2022 a French investigative book, Les Fossoyeurs (“the gravediggers”), by French journalist Castanet accused Orpea — then the largest private operator of nursing homes in Europe — of systematic neglect of residents and of financial misconduct. The chief executive of eleven years was removed within the month.3

The company’s market value fell from a peak of around €7 billion to below €150 million, and the restructuring that followed effectively wiped out the existing shareholders. What survived trades today as Emeis.3

The damage did not stop at the company accused. Clariane — the other large listed European operator, formerly Korian — fell sharply, even though its management rebutted most of the allegations made about care quality in its own facilities. Swedish, German and Spanish operators de-rated alongside them, in countries the book never mentioned. One investigation, into one company, in one country, repriced the listed care operators of an entire continent.4

Two other things happened at much the same time.

Covid gave the sector the worst advertisement imaginable. Care homes became, in the public mind, the place where the pandemic did its work. Occupancy fell, agency staffing costs surged, and the political salience of the industry went from nil to maximum in a matter of weeks.

Then came interest rates. Care operators are property-heavy, leveraged businesses. They had financed a decade of expansion through sale-and-leaseback, converting freehold into rent. When discount rates tripled, the asset side repriced downwards and the liabilities did not, and management teams spent three years selling real estate into a buyer’s market in order to survive rather than to grow.

The result is a sector that nobody has wanted to own for four years — precisely the condition under which we prefer to buy.


Three structural trends, none of them a forecast

Three structural trends drive our investment thesis — none of them requires anybody to either change their mind about anything or change their behaviour.

1. Demography is a given

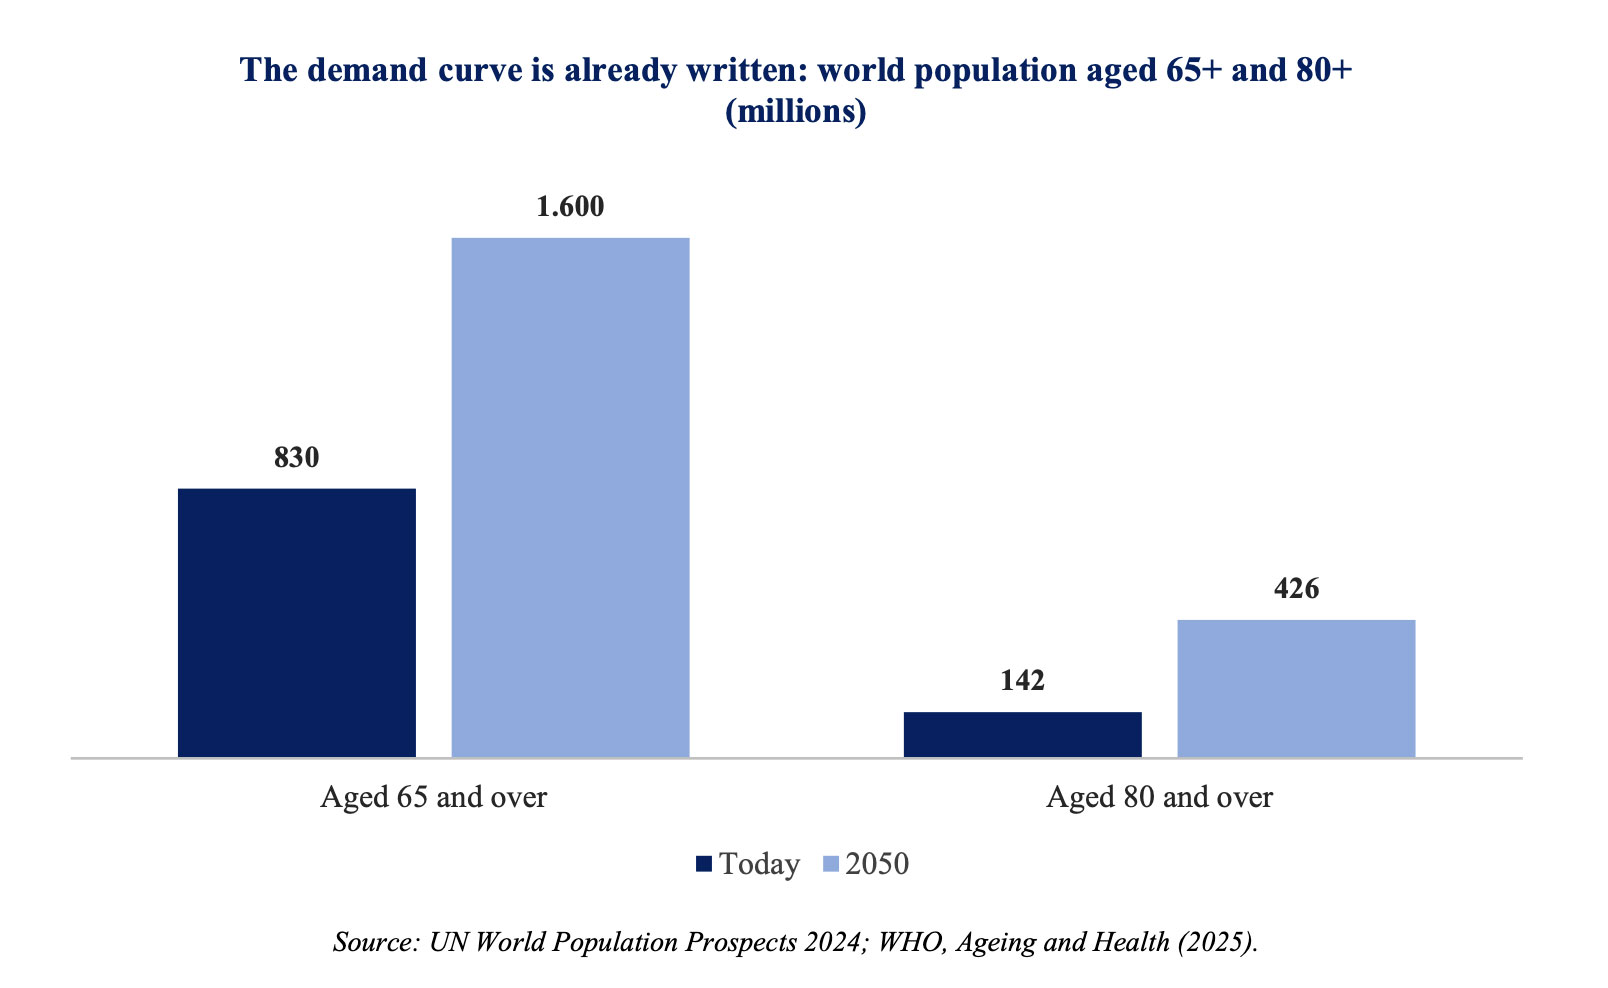
There are roughly 830 million people aged 65 or over in the world today. On United Nations projections that number roughly doubles, to about 1.6 billion, by 2050. The over-80s — the cohort that actually consumes care, as distinct from the cohort that merely retires — is expected to triple over the same period, to around 426 million.5
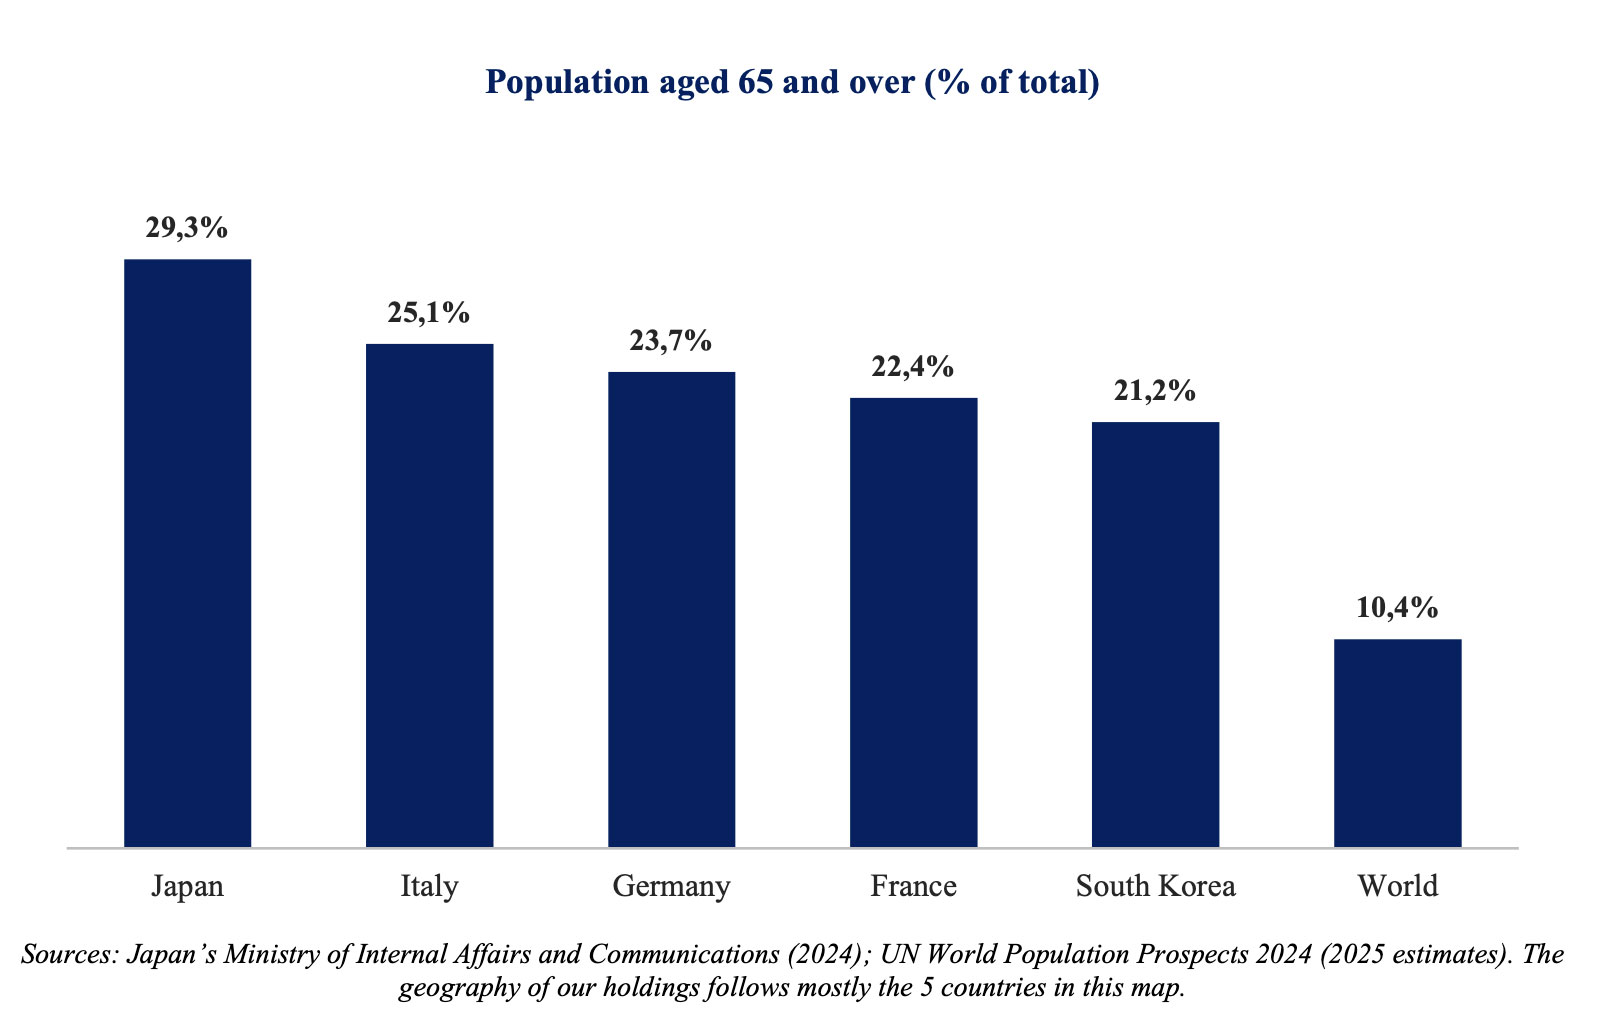
In Europe the number of people over 75 will rise from 66 million to 81 million, or 23% of the population, between 2021 and 2030.6 Japan is already there. Some 36 million people, 29.3% of the population, are over 65. Korea crossed the 20% “super-aged” threshold in December 2024 and stood at 21.2% by the end of 2025 — a transition accomplished in under twenty-five years, and one that continues towards 40% by 2050.7
Unlike other themes, this is one whose addressable market has already been born. Yet, we should be clear that while demography is predetermined, demand is not. What an ageing population actually consumes depends on reimbursement policies, prices, family behaviour and capacity. Demographics set the size of the addressable market; they do not guarantee that anybody gets to sell into it.

Japan — the world’s oldest major economy — is the natural laboratory for this theme. At 29.3% of the population over 65, Japan sits roughly where Italy will be in a decade and Germany shortly after. It has already run the whole experiment: it built compulsory insurance in 2000, opened home care to commercial operators, watched informal family provision fall to about 44% of all care delivered, and discovered that one of the most binding constraints was not money but staff. Whatever Europe is about to learn regarding the economics of elderly care, Japan has already learned. Japanese equities usually trade at a discount for being behind (in corporate governance, shareholder returns, etc). In this sector, perhaps, they trade at a discount for being ahead.

2. More old people means disproportionately more frail old people

Demand for care is not driven by the retired; it is driven by the very old, and it is the very old who grow fastest. The eighty-fifth birthday, not the sixty-fifth, is what fills a nursing or hospital bed.

Underneath that lies the fact that we are adding years to life faster than we are adding health to those years. The distance between how long a person lives and how long they live in good health — what epidemiologists call the morbidity gap — is not closing. It is widening. Global life expectancy at birth rose from 64.6 years in 1990 to 73.8 in 2023, a gain of about nine years. In the meantime, healthy life expectancy rose from 55.9 to 63.1, a gain of about seven. The missing two years went into the gap, which now stands at 10.7 years against 8.8 a generation ago. Life expectancy grew faster than healthy life expectancy in 203 of the 204 countries measured.8

Medicine is extremely good at preventing people from dying and much less good at preventing them from becoming frail. Every heart attack survived, every cancer converted into a chronic condition, every stroke followed by rehabilitation is a person who arrives at eighty-five needing help with washing, dressing and caring. The pharmaceutical industry mostly focuses on that first, survival stage. Our holdings mostly cater instead to the caring and nursing of the “survivors”.9

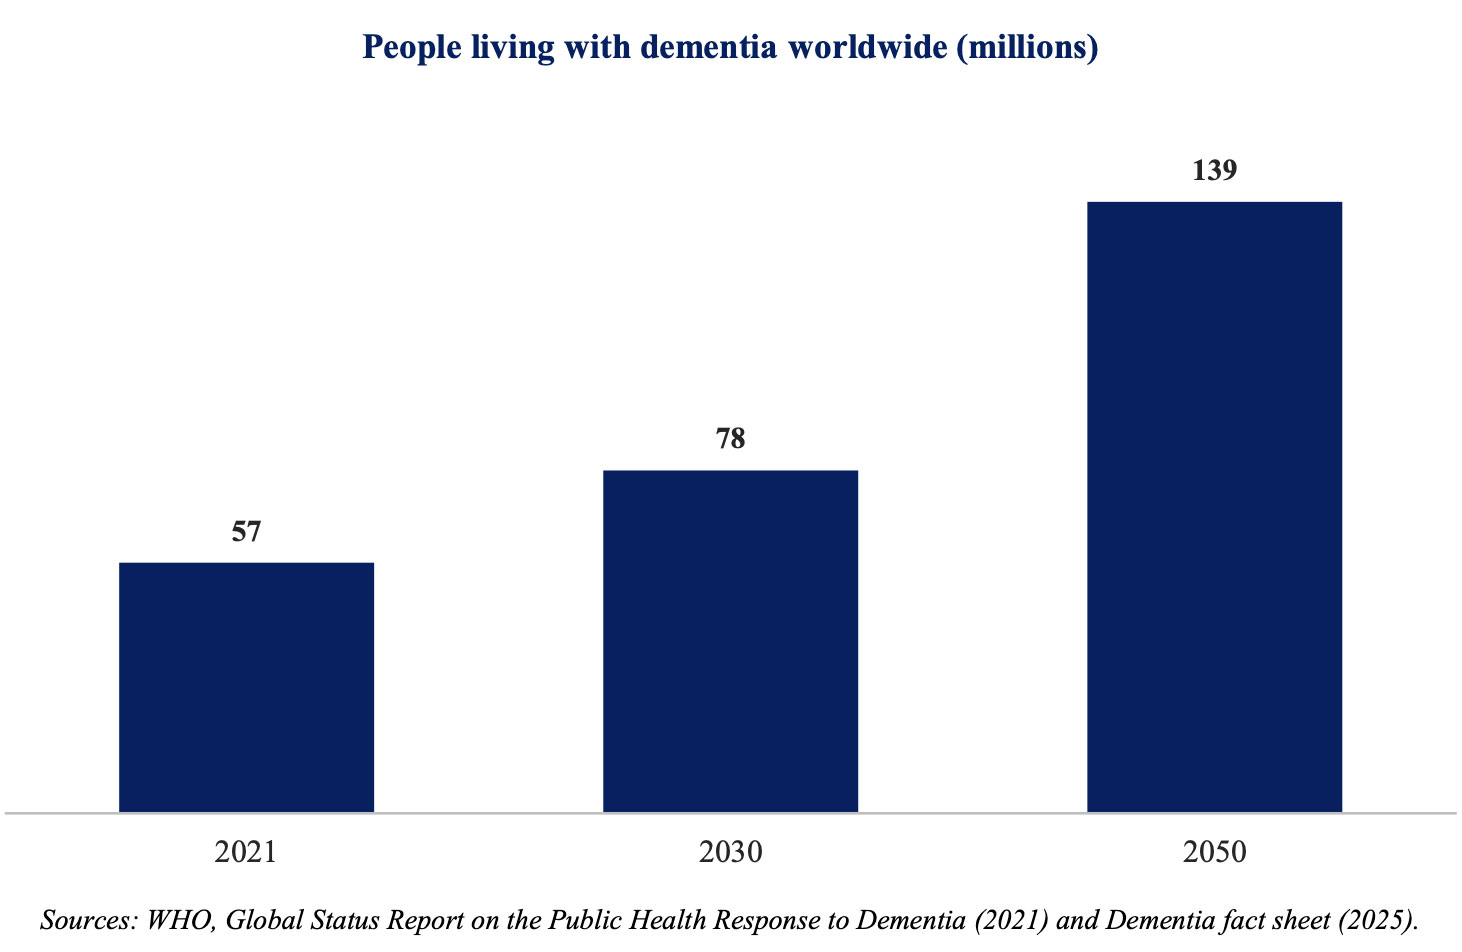
Dementia is the clearest single illustration. The World Health Organization put the number of people living with dementia at 57 million in 2021, rising to 78 million by 2030 and 139 million by 2050, with close to ten million new cases each year. The global cost was estimated at $1.3 trillion in 2019 and is expected to exceed $2.8 trillion by 2030. Roughly half of that cost today is informal care — unpaid work done by family members, averaging some five hours a day.10
3. The family has stopped being the supplier of care

The last figure in the previous section is key. Half the cost of dementia today is carried by families who are not paid for carrying it. That is not a cost that economies have avoided; it is a cost that economies across the world have hidden inside the households. As families shrink (and daughters who provide most of that care move to paid employment), the hidden cost has to be bought from somebody — and at that moment it stops being unpaid labour and becomes the revenue of a nursing home or a clinic. This is one of the mechanisms the ageing theme rests on: the demand does not have to be created. It only has to be transferred.

In Korea for example, the share of older parents supported by their families fell from roughly 19% in the 1970s to under 5% by 2020.11 Fewer children, smaller and more dispersed households, and more women in paid employment together dismantle the unpaid care system on which every society has silently relied. Care that was once provided free and invisibly inside the household is progressively converted into a service bought from a company with a payroll, a licence and, in some cases, a listing. Whether one welcomes that or not is beside the point; it is happening, and it is arithmetic.


Who pays — and who gets paid

The usual objection to investing behind a social trend is that the capital to fund it (and generate investor returns) may never appear. In long-term care, however, in the markets where we invest, it appeared decades ago.

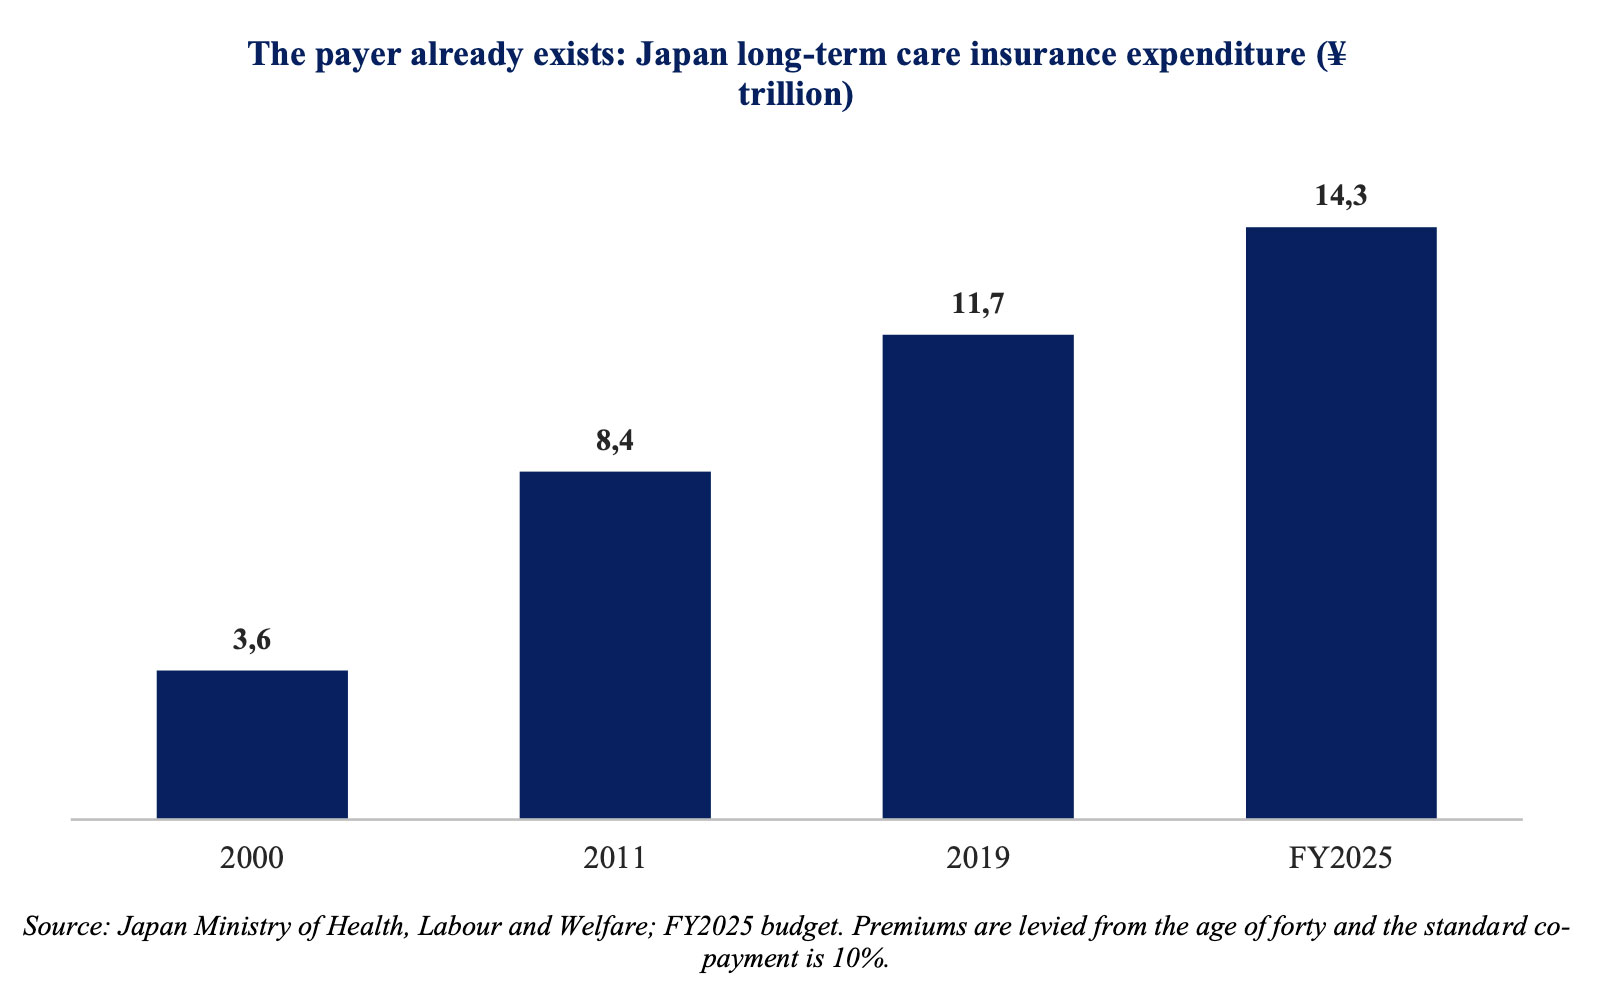
Japan introduced compulsory long-term care insurance, kaigo hoken, in 2000. It is funded by premiums levied from the age of forty, with a standard co-payment of 10%. Spending has risen roughly fourfold since inception, from ¥3.6 trillion in 2000 to ¥14.3 trillion in the FY2025 budget, around $91 billion.12
Korea followed in July 2008, collecting long-term care insurance as a supplement on national health insurance premiums. Germany has operated the Pflegeversicherung compulsory long-term care insurance since 1995. France funds long-term care through a more fragmented combination of national health insurance, departmental allowances and payments by the resident: the structure differs, the central fact does not, in that a material part of operator revenue is publicly financed.13

None of which would interest equity investors if all the money went to state-owned institutions. But it does not. In Germany a little over half of all German nursing homes belongs to the non-profit welfare associations (principally Caritas, Diakonie and the Red Cross, which remain the sector’s largest owners, and they are clearly not investable) while public ownership is roughly 5%. The balance, about 40%, are instead private for-profit businesses, up from 35% in 1999. Commercial providers account also for some 64% of domiciliary nursing services. In Korea the system was built on private supply from the outset, precisely in order to create capacity quickly, and commercial providers have held around three-quarters of the market ever since. In France the two large, listed operators — Emeis and Clariane — draw a substantial part of their revenue from publicly funded care payments. The state, in other words, is not a competitor in these markets.14

The revenue pool is usually mixed: in Japan the insurance pays for care while the resident pays rent and meals; in France care, dependency and accommodation have three different payers; in Germany the insurance rarely covers the whole cost of a place. What is common to all of them is that a compulsory or statutory payer funds a substantial part of the bill, and does so whatever the economic cycle is doing.

The state is not a competitor. It is a customer.


The supply side (and economics) of nursing homes

Everything so far has been about demand. The other half of the investment case is that supply cannot meet demand, and that this is not a temporary condition.

Barriers to entry are significant.

You cannot open a nursing home the way you open a restaurant. Licensing, planning permission, minimum staffing requirements, inspection regimes and admission to the public reimbursement system can take years and be refused. Switching costs are high: families do compare facilities before admission, and hospitals and insurers do put laboratory contracts out to tender; but moving a frail resident after placement is disruptive and rare, and established sample flows, accreditation and physician relationships are sticky.

These are not commodity businesses — although they have been priced as though they were.

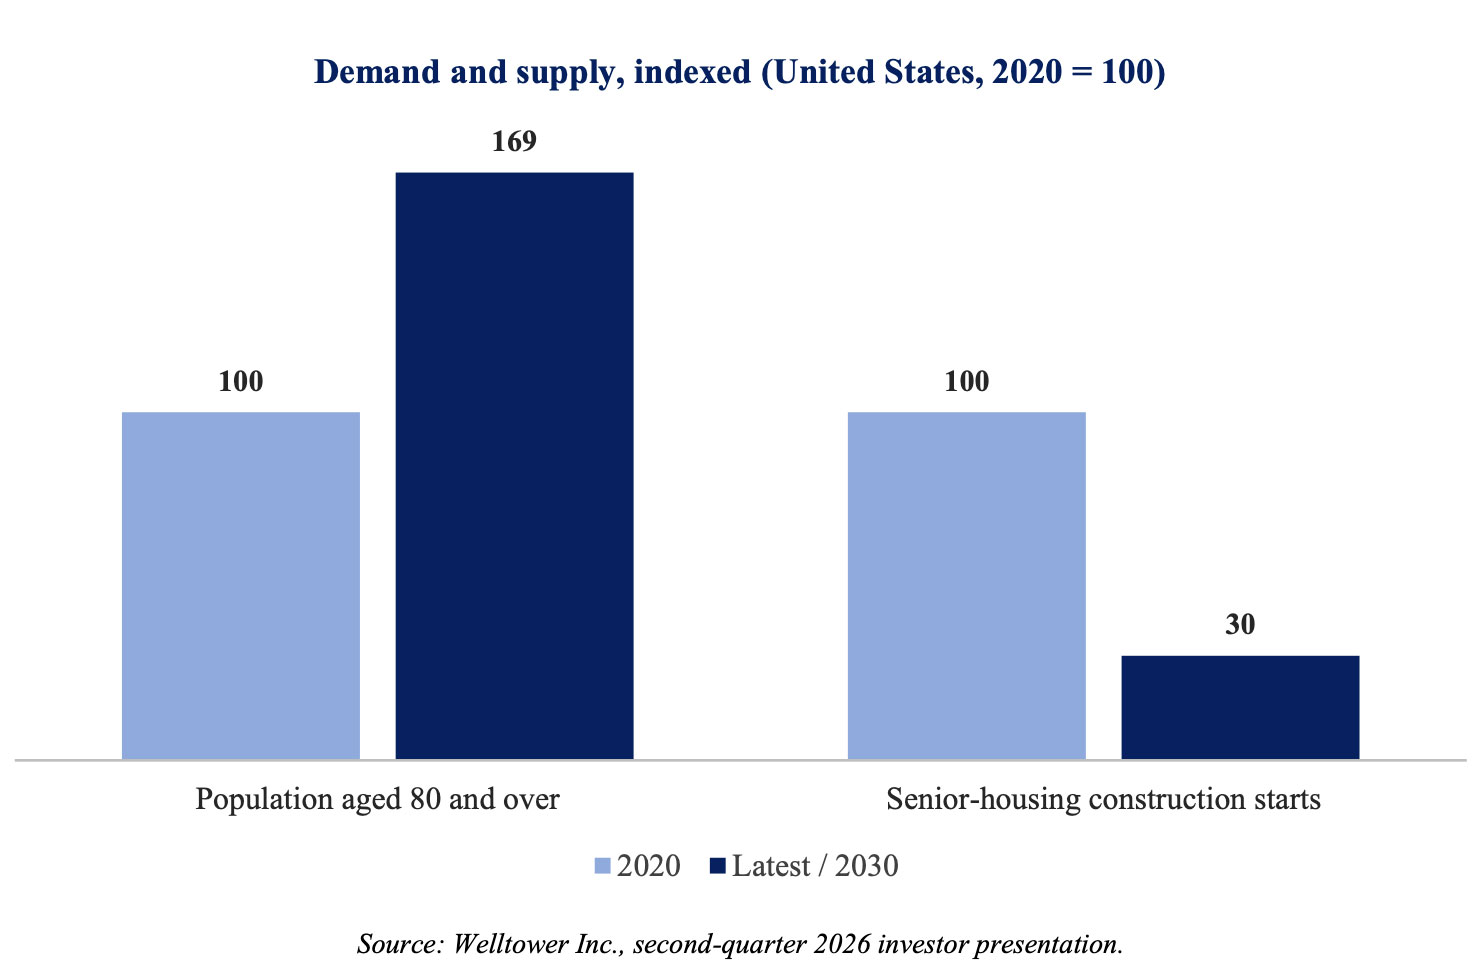
Bed availability is one of the key constraints on the supply side of nursing homes. In the United States, the only market that publishes these data, senior-housing construction starts is expected to fall by about 70% in Q4 2026 from the peak — at precisely the moment the population over eighty enters a decade of 5.4% annual growth (against 1.8% in the decade before). Europe and Japan publish nothing so precise, and we infer that capital was no more available there through the same years. No operator we follow has been building.15
In Japan, applications for places in subsidised (non-profit) nursing homes face queues of two to five years in urban areas.16 To the extent that under-capacity delays access to the non-profit institutional sector, demand is redirected towards fee-based, private, nursing homes and care operators.

Then labour, which is a binding constraint everywhere and cannot be solved by capital. Japan’s ministry plan requires the care workforce to grow from about 2.15 million in 2022 to 2.72 million by 2040 — an additional 570,000 people — in a country whose working-age population is shrinking by roughly half a million a year. There are currently around four vacancies for every applicant in Japanese care work, and more than a fifth of care workers are themselves over sixty. Korea reported a shortfall of some 190,000 nursing staff in 2023. Meanwhile the demand for that labour intensifies rather than merely grows: the over-75s are certified as needing care at six to seven times the rate of the 65-74 cohort, and Japan’s entire baby-boom generation crossed seventy-five in 2025.17

The obvious escape from a labour shortage is immigration, but this route is being closed off at precisely the wrong moment almost everywhere in the developed world. Japan has been opening its skilled-worker route for care work, but the scale is far below what the ministry’s own 2040 arithmetic requires. Removing the cheapest source of labour from a sector whose largest cost line is payroll raises wages, and whether that reaches the operating margin depends entirely on whether fees can follow. Of course, labour shortages make capacity harder to add for anybody: a competitor cannot open a new facility that it cannot staff, and potential new competitors face higher barriers to entry.

The other possible answer to a labour shortage is technology, via for example monitoring sensors and transfer assistance: it lowers the staffing ratio a facility needs, thus protecting private operators against wage inflation. Yet, over the longer term, technology is also a threat to fee-based nursing homes (and in fact it appears as a risk to the investment thesis in the risk section below), as it could substitute for beds altogether. The two effects would eventually pull in opposite directions and we would not pretend to know the net.18

Overall, persistent queues, difficult licensing and labour-constrained supply support high occupancy and give the operator some negotiating leverage — with the payer, and with private-pay residents. Of course, they do not confer full pricing power, because in a regulated sector the speed at which scarcity converts into price depends on tariff indexation, on the payer’s and public willingness to fund it and the (sensitive) politics around the issue. Yet, the last three years demonstrated that the conversion does happen — if slowly — as fee increases were passed through across Europe and Japan. Rising prices on frail old people is always politically challenging, but such increases tend to go through anyway, because the alternative for the payer and the family is often no bed at all.

Dementia and other high-acuity care command the highest monthly rates in senior living and the lowest price sensitivity, for the plain reason that a family with a parent who can no longer safely be left alone is not shopping on price. It is the least discretionary service in an already non-discretionary sector.
 

The valuation gap between the US and the rest of the world

Welltower, the largest senior-housing real estate investment trust, carries a market capitalisation above $160 billion and trades at close to forty times its own raised guidance for 2026 normalised funds from operations — on some estimates around twice its net asset value. Its investment case is partly based on a chart of the American population over eighty19 and is arguably evidence that the demographic curve is already converting into operating results today, rather than in some actuarial future.

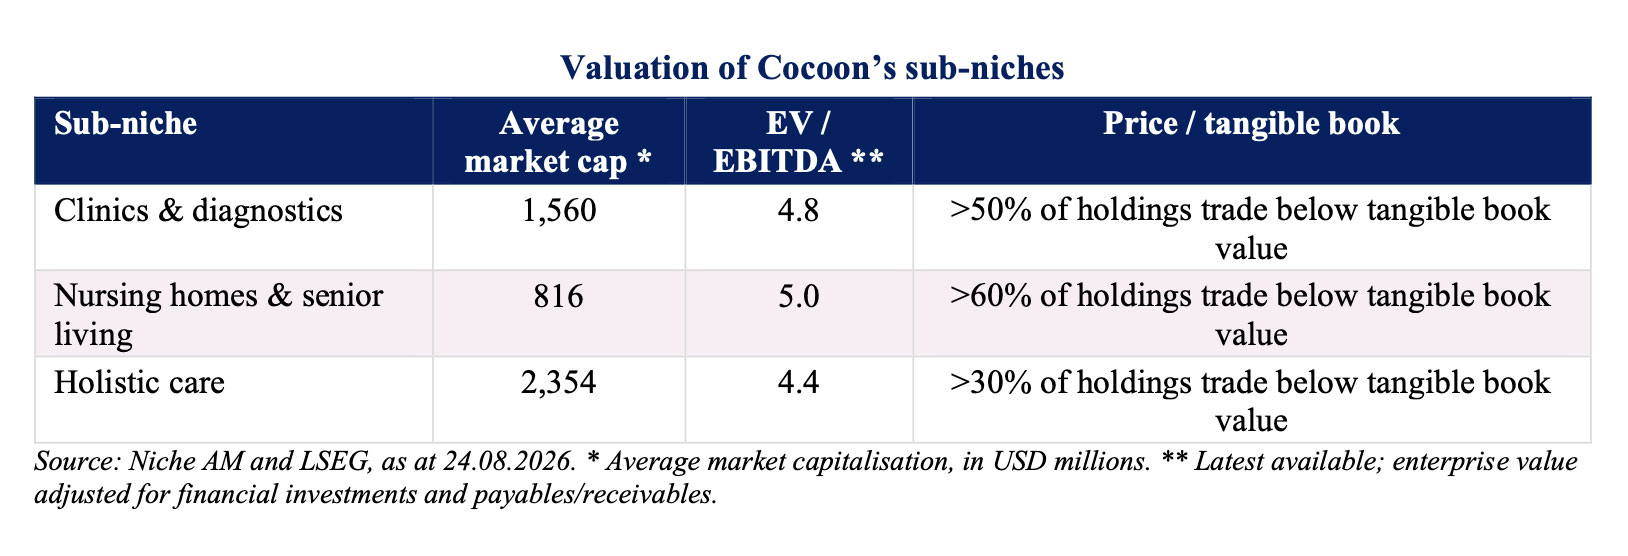
We express no view on whether that is the right price for Welltower. We simply observe that the same demographic chart bought in Tokyo, Seoul, Paris or Jakarta is available at under ten times earnings and below the value of its tangible assets, which are the average multiples across our holdings in this niche.

Why the valuation gap? Part of it is probably well deserved, and it has to do with scale, liquidity, capital structure and access to capital. Also, Welltower is in part a real estate landlord with no old people’s care operation, where it collects a contracted rent and passes wage inflation, staffing shortages and occupancy risks to the nursing home operator, so some of its cash flow genuinely does deserve a higher multiple than the cash flow of the business absorbing those risks.

Yet, Welltower’s senior-housing operating portfolio — the structure in which the trust takes the operating economics, wage inflation included, rather than collecting a fixed rent — now generates about 75% of same-store net operating income, and management has stated its intention to further raise the focus on senior-housing. In other words, the most expensively valued vehicle in the sector in the world has spent several years deliberately moving towards operator risk and has been re-rated upwards while doing it.20

The bottom line: equity markets seem to capitalise operating exposure to ageing generously when it arrives through a large, liquid, real estate, US platform, and capitalise the same occupancy and labour risk far less generously when it arrives through smaller Asian and European operators.


A brief overview of our ageing thematic portfolio

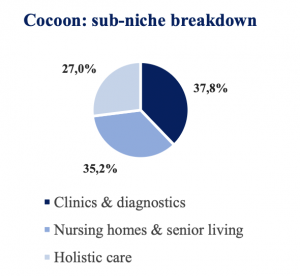
We invest in the ageing theme through all our portfolios, and we have a dedicated niche (named “Cocoon”) within our Asian Value Niche fund.21

The niche is built on three sub-niches.

Nursing homes and senior living
Operators in Europe, Japan and New Zealand. The European names are emerging from the crisis with visible operating momentum.22 The Japanese names never de-rated on scandal, because there was none — they de-rated on investor neglect.

Clinics and diagnostics
Laboratory networks, testing companies and diagnostic and med-tech equipment makers, principally in Japan, Korea and Indonesia. The second article in this series is devoted to them.

Holistic care (pharmaceuticals, nutrition and cosmetics)
Treating ageing as a disease rather than an inevitable natural process is one of the most disruptive paradigm shifts in modern medicine. For centuries healthcare has been reactive — waiting for people to develop age-related diseases and then treating those conditions. The new medical frontier, known as geroscience, aims to target the underlying biological mechanisms of ageing itself. Geroscience is also reshaping cosmetics.

The beauty industry has entered the era of “skin longevity”. Rather than masking the flaws of old age, modern formulations aim to treat the underlying cellular biology that causes skin to age.

Finally, in the context of geroscience, nutrition is no longer viewed merely as eating well, but as a way to reprogram the molecular hallmarks of ageing.23

What we do not own matters as much. We own no US healthcare REITs: the right exposure at the wrong price. We own no unlisted senior-housing developer, because we invest in public equities and are not paid to take illiquidity risk on a promise. And we own none of the fancy longevity-clinic wellness names, which are concepts with a story rather than proven businesses. If the wellness bubble deflates, our holdings are unaffected.


How we play it

We are not buying a longevity narrative in itself. We are deep-value investors: we buy cheap, profitable, asset-backed businesses, and it happens that a cluster of them today sits in the business of caring for and testing the old and sick. We are buying operators and laboratories at multiples that reflect years of reputational damage rather than the quality of the underlying assets.

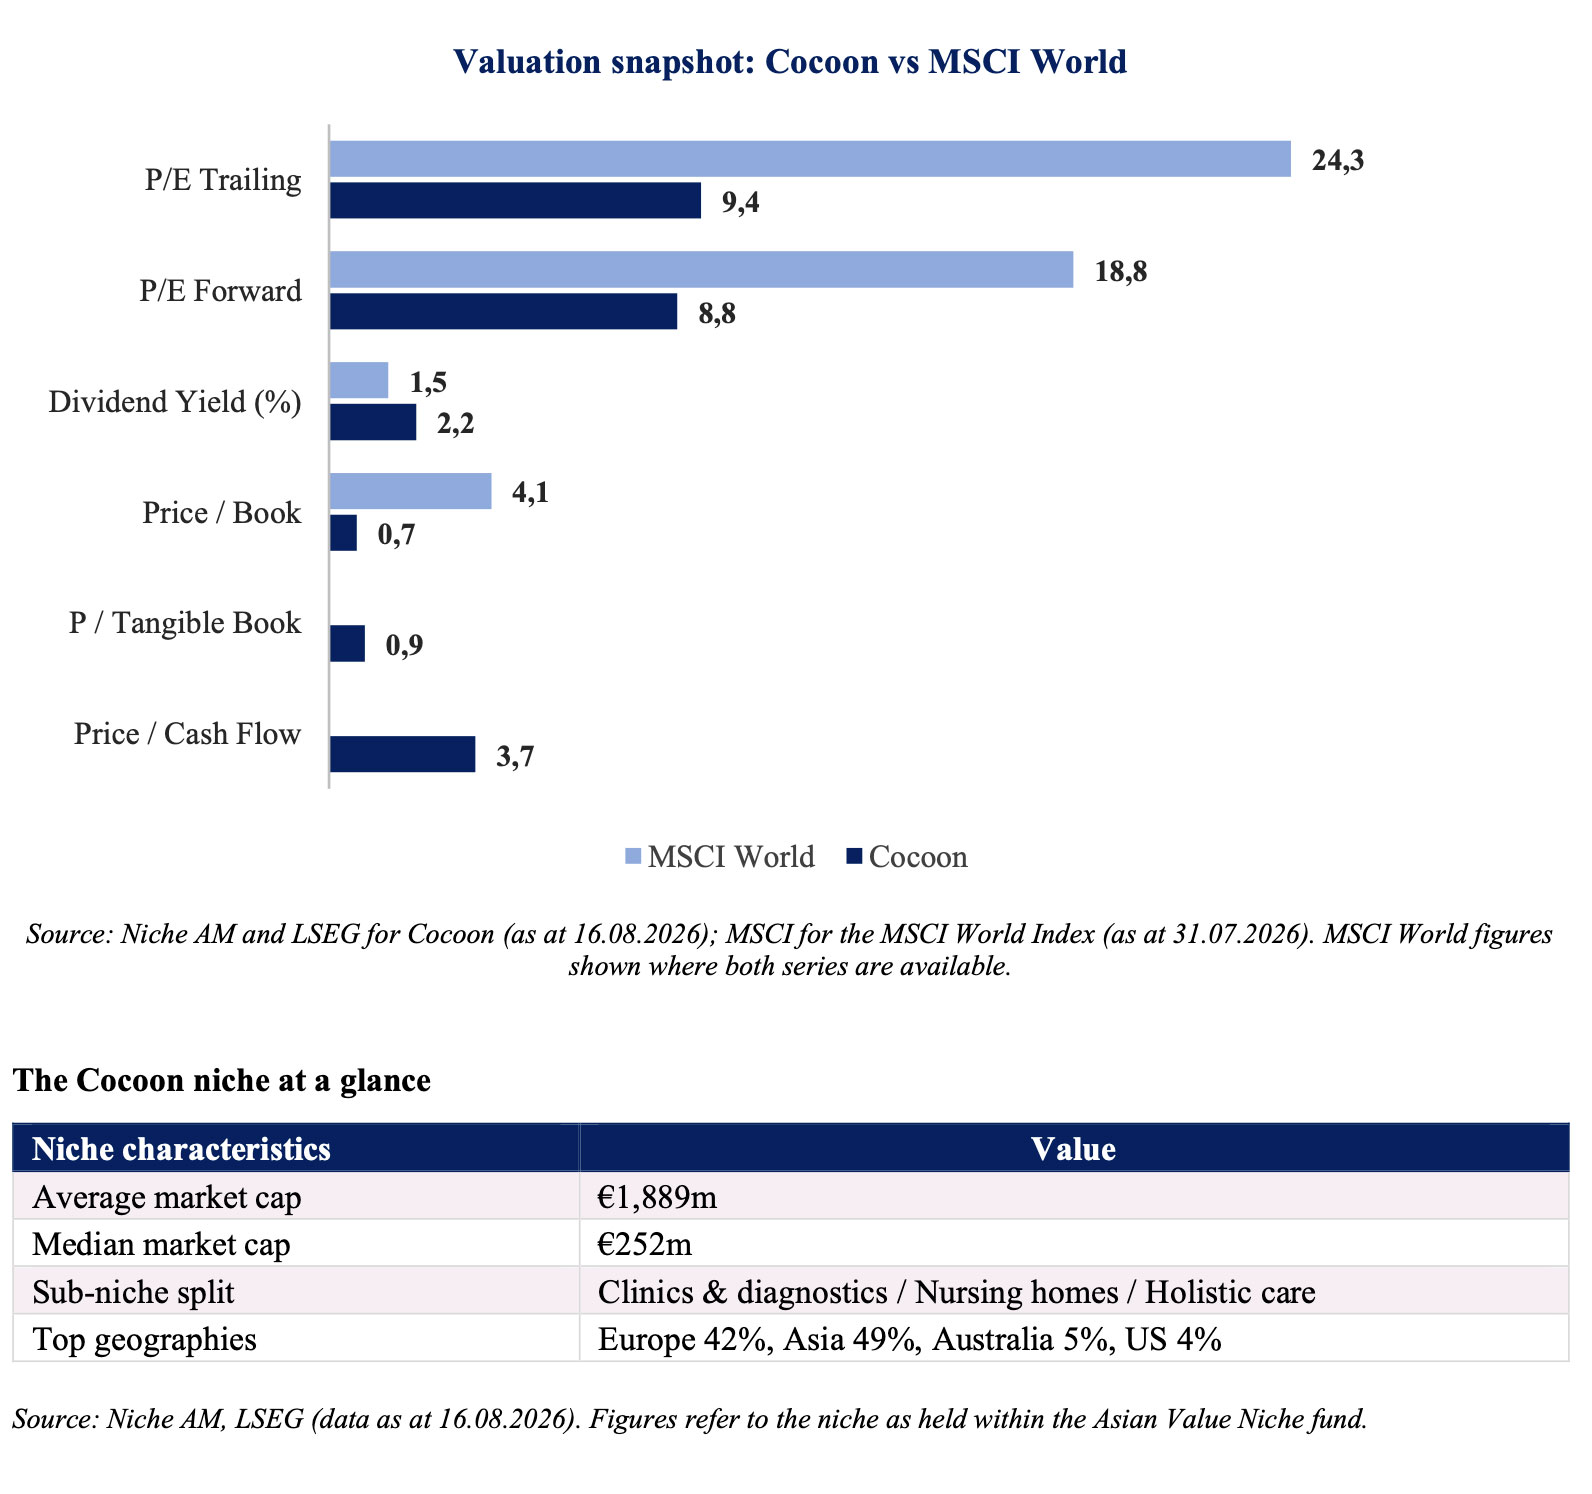
We require property ownership, net cash, or asset cover that does not depend on refinancing. Paying at or near tangible book does not eliminate execution risk, but provides downside support, especially if we turn out to be wrong about execution at individual holdings. We are not paying for any turnaround in advance. Our Cocoon niche trades at well under half the earnings multiple of the MSCI World index, at less than four times cash flow, and below tangible book. Several holdings trade below the value of their property alone or, in Japan, below net cash.

Governance is screened explicitly. Orpea taught the sector, us included, that in a business whose product is the care of vulnerable people, reputational risk is a serious balance-sheet and valuation risk, as well as an even more serious moral issue.

Consistent with our house style, the niche is highly liquid and diversified: tens of positions across three sub-niches and five countries are exposed to genuinely different drivers: nursing homes turn on reimbursements; clinics and laboratories on statutory testing volumes; holistic care to new science frontiers and immense all-age consumer demand. They do not fail or behave together.

The niche’s geographic exposure is also key. The industry is extraordinarily fragmented, most of all in Japan and Korea, where there is no cap on the number of providers and the market is dominated by individual and family operators. Scale could bring centralised purchasing, staff pooling across sites, occupancy management, and the ability to spread the compliance function. This means that markets like Japan and Korea could well see a wave of consolidation, thus helping drive valuations further. The operators and laboratories in Asia and Europe that make up this niche have a median market capitalisation of €252 million.


How our ageing thematic portfolio differentiates from the other vehicles exposed to the theme

The ageing theme is not unavailable to European investors.

However, the other industry vehicles hold mostly large cap names, have much higher valuation multiples than our deep value portfolio24 and focus mostly on pharmaceuticals, retirement finance, the spending of wealthy older consumers, and the automation required to replace ever fewer young workers. All businesses that benefit from people living longer, but not really “caring for” the people living longer (with perhaps the exception of pharmaceuticals).

In a sense, the market has not really ignored ageing: it has decided which version of ageing it is willing to own — the drugs that lengthen life, the institutions that finance the extra years’ consumption and the goods consumed during those extra years, rather than the care operators, clinics and laboratories that handle what happens when life gets longer (and harder). Which is instead what we do own via our Cocoon niche.

None of the above is meant to deride the other investment vehicles in the industry — we just want to make clear how we are different.
 

Why now?

We are not in the business of timing entries and exits. The question worth answering is narrower: what, if anything, has changed.

What has changed is that the operational evidence has turned while the multiple has not.

Occupancy across the European operators is back at or near pre-pandemic levels, and occupancy is the variable that matters disproportionately here. A care-home incurs most of its property, management and minimum-staffing cost whether a room is filled or not, so once a minimum level is covered an additional resident arrives at a contribution margin far above the facility average: the operating leverage sits in the last few points of occupancy, which are precisely the points now being recovered.

Fee increases have also been passed through. Agency staffing costs, the single largest source of margin damage during Covid, are normalising. Balance sheets have been repaired through disposals and capital increases. The rate cycle has stopped working against property-backed businesses. And, as mentioned above, no new capacity has been financed for years, so it cannot arrive quickly even if it were ordered today.

It is fair to ask what makes this entry point different from the earlier ones, given that this sector has been sold as “grey gold” before and disappointed every time. The honest answer is that almost nothing about the demographics has changed. What has changed is everything about the price and the balance sheet.
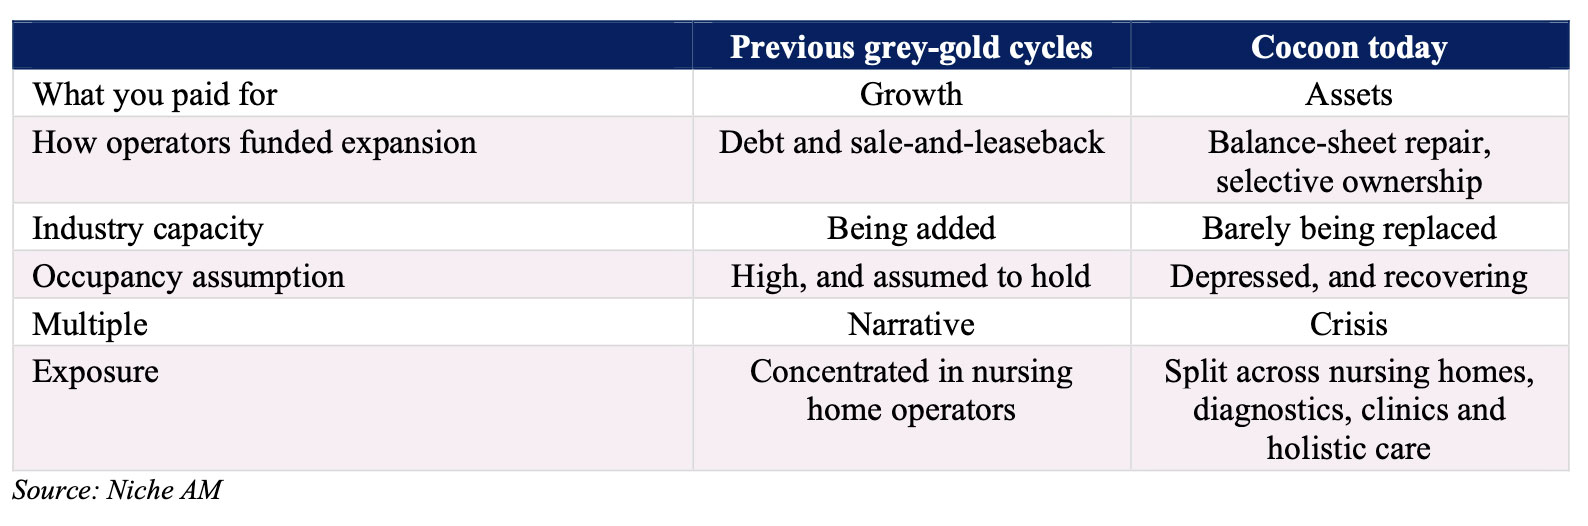
 

Investment conclusion

We are making no argument about how societies ought to look after their old. Nor are we claiming to have the only or best investment vehicle to play the ageing theme in the industry. Our Cocoon vehicle is just one (different) way of providing leverage to the ageing niche, and it rests on demography, on the collapse of unpaid family care, on funding mechanisms that already exist and are already compulsory — and, above all, on valuation.

The market threw out a structural theme along with the scandal that briefly surrounded it. What is left is cheap, asset-backed and, at last, operationally improving. The need for old people’s care is not in question. Its conversion into profitable growth is — and today’s prices assume far too little of it.


Risks to the investment thesis

Five developments could erode the case. In each case, though, the downside is limited by the kind of businesses we own: cheap, asset-backed, frequently trading near or below the value of their property.

1. Care moves home. Domiciliary care, remote monitoring and AI-assisted support may substitute for beds. It is usually cheaper, and most older people would prefer it: surveys consistently find a strong preference for “ageing at home” vs. nursing homes.25 Yet home care is also a service bought from a company rather than provided free by a daughter or son, so the migration from unpaid to paid care continues either way. The highest-acuity residents, and most advanced dementia, cannot be managed at home at acceptable cost. And the diagnostics half of our Cocoon niche is indifferent to where care is delivered.

2. The payer squeezes. These are regulated revenues, in large part publicly funded, and the political temptation to for example freeze tariffs below cost inflation is often high. Labour costs, meanwhile, rise structurally in shrinking workforces, and immigration restrictions could remove the cheapest source of labour supply. Payroll is the largest single cost line in every operator we own. If wage inflation were to run persistently ahead of tariff indexation, margins would compress faster than occupancy could repair them, and there could not be a compelling reason why a public payer under fiscal strain should index tariffs to a nursing-home’s wage bill. This is the risk we would rank first in terms of probability or impact. Yet tariffs were in practice indexed upwards through the inflation shock of the last 3 years; agency-staffing costs are already normalising; and we own asset-backed balance sheets rather than pure operating margins.

3. Another scandal. The product here is the care of vulnerable people, and governance failure is a permanent tail risk that seems to reprice the whole sector and not merely the offender — as Orpea demonstrated. We mitigate it in the only ways available: diversification across three sub-niches and five countries, with no position representing a material weight of the portfolio.

4. Healthy ageing. Future cohorts may reach eighty in better condition than their parents did, delaying the onset of dependency and compressing disability into a shorter period at the end of life. If that happens, care intensity at any given age falls, and the number of people over eighty overstates the number of people who need care. It is worth recalling that the largest test of the hypothesis, published in July 2026 and set out earlier in this article, found the opposite in 203 countries out of 204.26 We would also distinguish sharply between two claims: that care needs arrive later, which is plausible and would genuinely compress the revenue pool at the margin, and that they disappear, for which there is very little evidence. Compression of morbidity moves the demand curve to the right. It does not delete it.

5. Demography is not a business plan. Some of our holdings are turnarounds: they require management teams to rebuild occupancy, margins, balance sheets and public trust at the same time, and turnarounds of course can fail. The Japanese and Korean holdings need less repair but more patience, since nothing obliges a cheap, well-capitalised domestic company to re-rate on any particular timetable. Our defence is not confidence in management. It is the entry price and the asset backing: paying close to tangible book for businesses whose demand is not in question is what allows us to be wrong about execution at selected holdings and still be right about the niche.


Sources & notes

1 See for example Yuval Noah Harari, Homo Deus: A Brief History of Tomorrow (2015).

2 The reference is to Welltower Inc., the largest listed owner of senior housing and the vehicle through which most capital expresses this theme in the US — it is discussed later in this Niche Insight. Nothing in this article is a recommendation regarding Welltower, which is not a holding of the niche.

3 Victor Castanet, Les Fossoyeurs (Fayard, January 2022); Savills, UK & European Care Home Investment (1 July 2025)

4 Savills, “Green shoots emerge in troubled European care-home sector” (October 2025).

5 United Nations, World Population Prospects 2024; UN DESA Population Division; Our World in Data (2024); WHO, Ageing and Health, 2025.

6 United Nations population data.

7 Japan’s Ministry of Internal Affairs and Communications / Statistics Bureau (2024); Carnegie Endowment, “Governing Aging Economies: South Korea and the Politics of Care, Safety, and Work” (March 2026).

8 “Global, regional, and national trends in the morbidity gap”, The Lancet Public Health, 21 July 2026; analysis by the Institute for Health Metrics and Evaluation, senior author Christopher Murray; Jonathan Guthrie, Financial Times (13 August 2025).

9 There is nothing to celebrate in frailty, and we take no satisfaction in a business model that depends on it. The care of the very old is work that has to be done by somebody, it is chronically underfunded and undervalued almost everywhere, and the companies that do it well deserve capital rather than the neglect they have received. Our argument is simply that a structural and entirely foreseeable shift in where that care is provided — from the family to the balance sheet of a licensed company — is not reflected in the price of the companies concerned.

10 World Health Organization, Dementia fact sheet (2025) and Global Status Report on the Public Health Response to Dementia (2021); Alzheimer’s Disease International, Dementia Statistics.

11 Korea: family-support data cited in Age and Ageing, vol. 52 (2023). Japan dependency ratio, EU births and global fertility: Valentina Romei, “Five ways demographics are transforming the world economy,” Financial Times (6 March 2026), drawing on UN World Population Prospects 2024, OECD and ILO data.

12 Japan’s Ministry of Health, Labour and Welfare; FY2025 budget.

13 Korea’s National Health Insurance Service; Germany’s Bundesgesundheitsministerium; France’s Caisse nationale de solidarité pour l’autonomie (CNSA)

14 Germany’s Statistisches Bundesamt care statistics, as analysed in Ageing International 40 (2015); Korea: Jeon & Kwon (2017), in Journal of International and Comparative Social Policy (2022); France: emeis and Clariane annual reports.

15 Welltower Inc., second-quarter 2026 investor presentation (July 2026).

16 Japan’s Ministry of Health, Labour and Welfare surveys of applications for admission to nursing homes; Japan Times; Akiya Japan, June 2026. Waiting lists measure applications rather than individuals and some applicants appear more than once, so the figure should be read as an order of magnitude for unmet demand rather than a precise count.

17 Japan’s Ministry of Health, Labour and Welfare – 9th Long-Term Care Insurance Business Plan (2024); Geriatrics & Gerontology International, 2023; Long-Term Care Insurance Business Status Report; Journal of International and Comparative Social Policy, 2022.

18 Japan’s Ministry of Health, Labour and Welfare subsidy programmes for care technology and recruitment, FY2026; Valentina Romei, “Five ways demographics are transforming the world economy,” Financial Times (6 March 2026).

19 Welltower Inc. company filings; Bloomberg. Multiples for real estate investment trusts are quoted on funds from operations and are not directly comparable with the price-to-earnings ratios of operating companies; the comparison is made to illustrate the difference in market enthusiasm, not to equate the two metrics.

20 Welltower Inc., first- and second-quarter 2026 results and investor presentations.

21 The niche takes its name from Cocoon, the 1985 film in which a group of residents of a Florida retirement home swim in a pool that has been used to store alien cocoons and find their vitality restored.

22 emeis, first-quarter 2026 trading update (May 2026); Savills, UK & European Care Home Investment (July 2025).

23 Carlos López-Otín, Maria A. Blasco, Linda Partridge, Manuel Serrano and Guido Kroemer, “The Hallmarks of Aging”, Cell 153(6), 6 June 2013, which set out nine hallmarks and founded the field; and “Hallmarks of Aging: An Expanding Universe”, Cell 186(2), 19 January 2023, which extends them to twelve. Whether ageing itself should be classified as a disease remains contested, not least at the World Health Organization; we return to this issue in the third article of this series.

24 Blackrock’s iShares Ageing Population UCITS ETF, tracking the STOXX FactSet Ageing Population index, trades at about 18.1 times earnings and 2.34 times book value as of Blackrock’s own published figures as at late July 2026.

25 Jonathan Guthrie, “What are my chances of ending up in a care home?”, Financial Times (13 August 2025); Valentina Romei, “Five ways demographics are transforming the world economy,” Financial Times (6 March 2026).

26 The compression-of-morbidity hypothesis originates with James F. Fries, “Aging, natural death, and the compression of morbidity”, New England Journal of Medicine 303 (1980). Subsequent evidence is mixed: see the WHO World Report on Ageing and Health and “Global, regional, and national trends in the morbidity gap”, The Lancet Public Health, 21 July 2026.


Legal disclaimer

This document, together with any presentation and related material, is intended exclusively for marketing and information purposes. It is not a legally binding document, contains no representation and does not constitute an offer or invitation to invest in any of the funds of Niche Asset Management Ltd. (the “Fund”). Furthermore, it does not constitute a solicitation for any such offer or invitation, nor may it be regarded as part of it or of its distribution in connection with any contract relating to the Fund. This document, any presentation made in conjunction with this document and any related material are preliminary and for information purposes only. They do not constitute an offering memorandum, contain no representation and neither constitute nor form part of an offer or invitation to subscribe for any of the Niche funds (each, the “Fund”). Furthermore, they neither constitute nor form part of any solicitation of such offer or invitation, nor do they (or any part of them), nor the fact of their distribution, form the basis of, or may be relied upon in connection with, any contract relating thereto. The information contained in this report document has been compiled solely by Niche Asset Management Ltd (known as “Niche AM”), authorised and regulated by the Financial Conduct Authority (RN783048) and registered in England and Wales 10805355. The information and opinions contained in this document are not intended to be complete and may be subject to change at any time. No representation, warranty or undertaking, express or implied, is given as to the accuracy of the information or opinions contained in this document, and Niche Asset Management Ltd and/or its partners accept no liability for the accuracy and completeness of the information. Investments in the funds are subject to market risks, including the potential loss of capital.

The Fund’s investment strategy is speculative and entails a significant risk of losing part or all of the capital invested. Market, political, counterparty, liquidity and other risk factors may have a significant impact on the Fund’s investment objectives, while past performance is neither a guide to nor indicative of future results. The distribution of this document and the offering of the Fund’s units may be restricted by law in certain jurisdictions, and accordingly anyone coming into possession of this document should be aware of and comply with any applicable laws or regulations. Niche AM’s funds are not yet available for distribution in all countries. Prospective investors are invited to contact Niche AM to verify the countries of registration. Any failure to comply with these restrictions may constitute a violation of the laws of such jurisdiction. The reproduction of this information, in whole or in part, without the prior consent of Niche AM is also prohibited. This document may be communicated or passed only to persons to whom Niche AM is permitted to communicate financial promotions pursuant to an exemption provided under Chapter 4.12 of the Conduct of Business Sourcebook (“COBS”) (“Permitted Recipients”). Furthermore, no unauthorised person may communicate this document or otherwise promote the Funds or the units therein to a person in the United Kingdom, unless that person is (a) a Permitted Recipient (b) a person to whom an authorised person is permitted to communicate financial promotions relating to the Fund or to promote the Fund under the COBS 4.12 rules applicable to that authorised person. The securities mentioned in this document have not been registered under the Securities Act of 1933 (the “1933 Act”) or under the securities laws of any other US jurisdiction.

Such securities may not be sold or transferred to US persons unless such sale or transfer is registered under the 1933 Act or exempt from such registration. This document is a marketing communication intended exclusively for professional investors. Prospective investors are advised to read carefully the Prospectuses and the Key Investor Information Documents (KIID) for all details, including risk factors and fees, before making any final investment decision.

Prospectuses, supplements, KIIDs and a Summary of Investor Rights are available free of charge at https://nichejungle.com/regulatorydocuments and at https://nicheam.com/legal.

Do you enjoy our Niche Insights? Read more here

Follow us on LinkedIn


Niche Asset Management Limited
Authorised and regulated by the Financial Conduct Authority
17 Lennox Garden London SW1X 0DB – Registered in England – No. 10805355


Read More

15
Jul
2026
No meat’s land
Posted On July 15, 2026  By admin  And has No Comment

The inevitable (and investable) trend towards alternatives to meat

Only a few years ago — propelled in part by a post-Covid appetite for all things healthy and green — eating less meat looked like a powerful new trend, and alternative-meat stocks became an equity-market fashion. A handful of loss-making names IPO’d into euphoria, then deflated almost completely. Today the theme is off the radar — the narrow alternative-meat story and the broader alternative-proteins one alike. We think that is a mistake. The two forces that make a gradual, long-term shift away from meat hard to avoid — the well-established human-health risks of eating a great deal of it, and its outsized burden on the planet — have not weakened; if anything, the evidence has hardened. Over the coming years a third force may drive this shift too: national food-security policy. In the meantime, as with electric vehicles, powerful lobbies and cultural inertia keep the gap between what the science says and what people do irrationally wide and slow — but that gap is precisely where patient, contrarian capital gets paid. Through our No Meat’s Land niche we own profitable, cash-rich, dividend-paying companies across the plant- and seafood-protein supply chain, bought at deep-value multiples while no one is looking.

A theme the market has left for dead

The Impossible Whopper: Burger King’s 2019 plant-based launch, the high-water mark of the first alternative-protein boom.

In 2019 a company called Beyond Meat went public in one of the most successful IPOs since the 2008 financial crisis, valued at close to $4bn. Its shares surged 163% on their first day of trading and quadrupled within months. Burger King put a soy-based patty under the Whopper name, Impossible Foods became the talk of Wall Street, and “alternative protein” briefly turned into a portfolio line item. US plant-based meat sales rose 45% to $1.4bn in 2020 as the category boomed.

Then the cycle turned, hard – especially for the alternative meat products. Beyond Meat’s market value has fallen to well under $400m — a roughly 90% drawdown from its IPO peak. The share of American adults regularly eating plant-based meat has gone nowhere, staying in the single digits.1 Prices do not help: a pound of beef mince at Walmart, America’s biggest grocer, sells for $7.43, against $9.04 for an Impossible alternative — the opposite of the value proposition the category needs.2

Taste and an unflattering “ultra-processed food” label played a part too, as does a culture-war backlash across the world (in the United States, the Health Secretary, Robert F. Kennedy Jr., has toured the country under the slogan “Eat Real Food” and told cattle ranchers something like “the war on beef is over”3).

Yet, the business and investment upside from the wider alternative-proteins theme remains vast: plant-based meat for example remains roughly 1% of the US retail meat market, against a conventional meat industry worth on the order of $1.7 trillion a year.4

None of what follows is an investment case for vegetarianism on moral grounds. It is a case grounded in health, economics, the basic biology of raising animals, geopolitics and, above all, valuation.5


The trend towards alternatives to meat is structural, not a fad

Two drivers carry most of the weight. Both are based on established facts about human health and about the biology of turning crops into animal protein — facts that, over time, are likely to exert a steady downward pressure on how much meat the world produces and consumes.

1. Meat carries well-established health risks

In 2015 the World Health Organization’s International Agency for Research on Cancer reviewed more than 800 studies and concluded that processed meat is a Group 1 carcinogen — the same evidence category as tobacco.6 Red meat is Group 2A, “probably carcinogenic.” Each 50-gram daily portion of processed meat is associated with about an 18% higher risk of cancer — figures reaffirmed in subsequent reviews.7 When meat starts to go off, bacteria break down the muscle tissue and release cadaverine, the compound that gives decaying flesh its characteristic smell. It is more than a marker of spoilage though. In cured and processed meats (such as bacon, ham, salami, hot dogs), cadaverine reacts with the nitrites used as preservatives to form nitrosamines, a family of compounds known to cause cancer.8

Newer evidence adds weight from two different directions. A 2026 study in Nature Medicine followed roughly 100,000 American health professionals from middle age into their seventies: those in the top tenth for red-meat consumption were less likely to reach 70 at all, and those who did were more likely to suffer chronic illness and less likely to be in good cognitive, mental and physical health — a larger effect than for other unhealthy foods in the same study.9

Separately, a randomised-controlled trial — a stronger form of evidence than the observational studies above, since diet is assigned rather than self-reported — found that a diet rich in red meat raised participants’ cholesterol and a heart-disease-linked compound called TMAO compared with a meat-free diet matched for saturated fat.10 Also, higher processed-meat intake is associated with materially higher rates of cardiovascular disease and type-2 diabetes across very large cohorts.11

The current meat production model carries another important cost. Intensive livestock farming is the world’s largest consumer of antibiotics — most estimates put the share of medically important antibiotics given to farm animals at around 70% — much of it used not to treat sick animals but to keep healthy ones alive at high stocking densities. The risk is not only drug residues in the meat, but the bacteria this heavy use of antibiotics could breed: resistant strains that medicine can no longer kill. Antimicrobial resistance is now treated by some governments and institutional investors as a serious long-term threat, and it is already drawing a degree of engagement pressure onto the listed meat majors.12

The point for an investor is not that meat is poison, but that the health costs of consuming a great deal of it are well documented from several independent lines of evidence, and that public awareness of them — and the regulatory pressure that tends to follow it — is far likelier to rise than to fade, creating thus the opportunity for an exploitable structural trend.

2. Meat is expensive for the planet

As Europe endures another summer in the grip of record-breaking heat, concerns about global warming have returned to the fore. Yet public attention is focused almost entirely on the fossil fuels the world burns for energy; far less is said about the warming caused by the way the world eats.

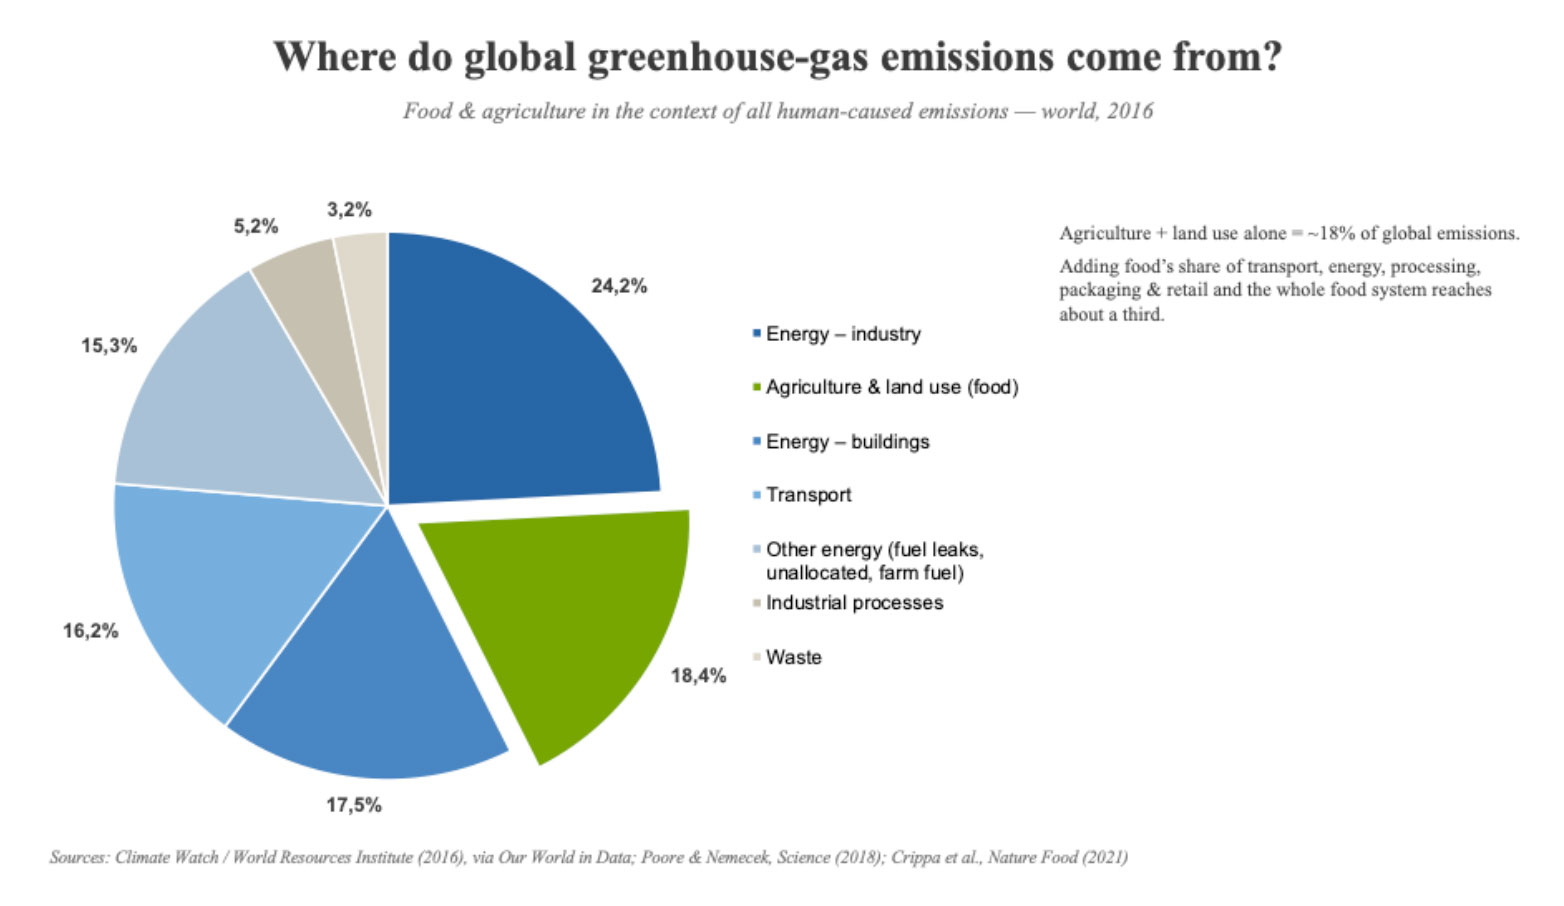
Raising animals for food — the whole chain from growing their feed to the farm gate — accounts for roughly 15%-20% of all human-caused greenhouse-gas emissions, depending on the methodology — the most recent and comprehensive estimate, published in Nature Food, puts it near the top of that range. The broader food system, including land-use and crop agriculture, accounts for roughly a third of global emissions — large enough on its own to threaten the Paris Agreement’s targets of limiting global warming to 1.5°C, and eventually 2°C, even if fossil fuels were phased out entirely.13

The main culprit is cattle and precisely methane, a gas with roughly 28 times the warming power of CO₂ on the standard hundred-year measure (and some 80 times over a twenty-year horizon, which is the timeframe that actually matters for hitting mid-century targets), which cattle produce as they digest and release as flatulence and, overwhelmingly, by belching. A single cow emits on the order of 70 to 120 kilograms of methane a year: in a sense, the world’s herd of cows is, collectively, a very large and inefficient source of useless gas.14

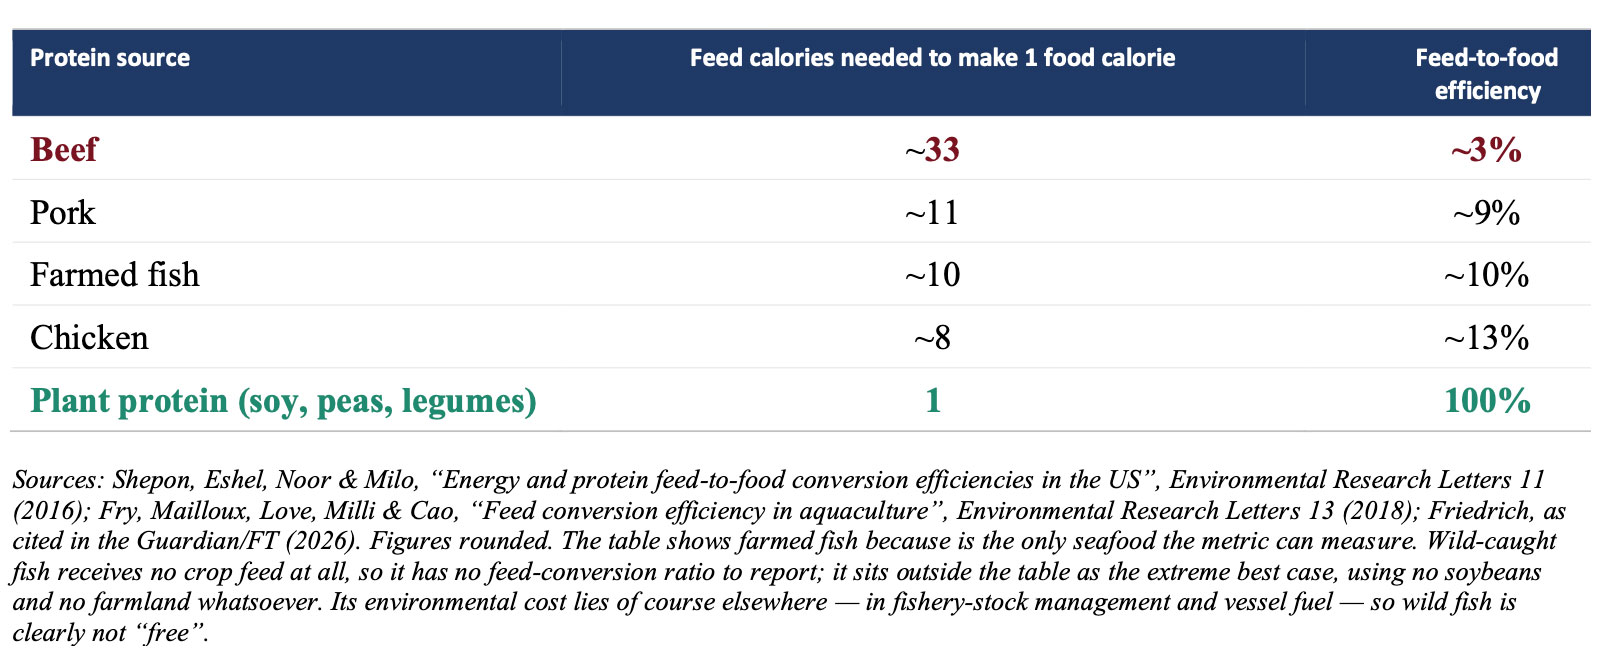
The feed-conversion arithmetic (and economics) — i.e.: how much crop energy it takes to produce a given amount of animal-protein energy — is just as stark. It takes roughly eight calories of crop feed to produce one calorie of chicken, eleven calories for pork, and at least 33 for beef!15

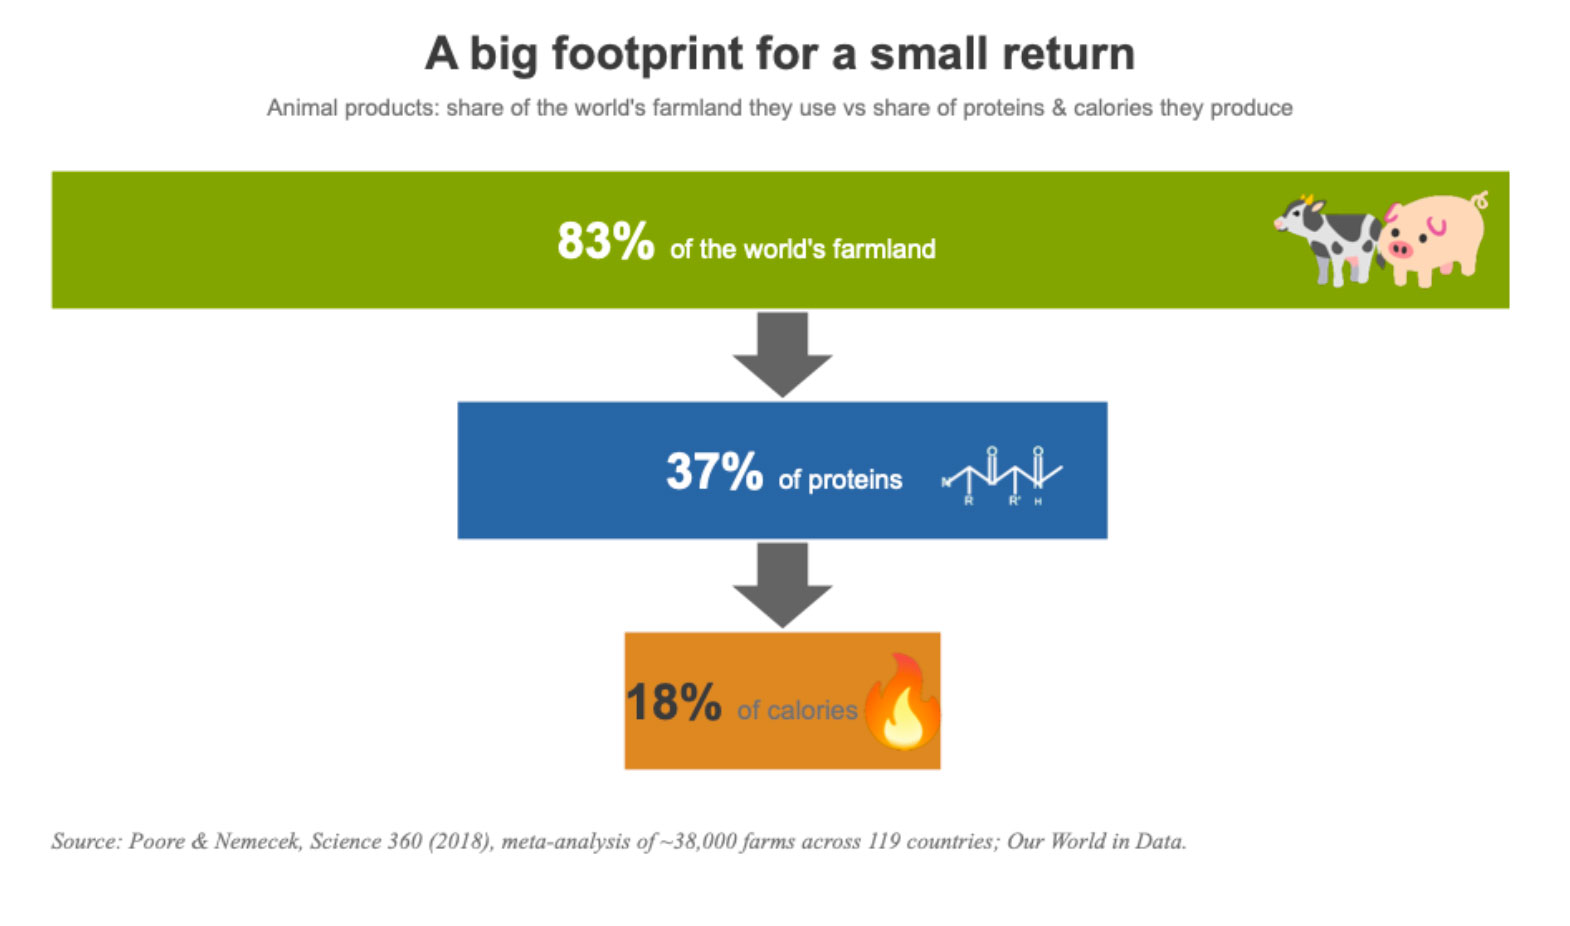
That inefficiency shows up also in land and water use. The largest study ever conducted of global food systems found that animal products occupy about 83% of the world’s farmland while supplying only around 18% of world’s calories and 37% of proteins.16

Water tells a similar story. It is estimated that the water footprint per calorie of beef is about twenty times that of cereals, and, more visually, that a kilogram of beef requires around 15,000 litres of water, against roughly 2,000 for soy (though it is fair to note that most of the beef figure is rainfall falling on pasture rather than water drawn from rivers or aquifers).17

Add deforestation — of which livestock is a leading cause — together with biodiversity/species loss, and the conclusion is not ideological but obvious: the current way of producing protein becomes increasingly hard to scale sustainably as the world grows richer and more populous.


The tobacco and EV parallels

If the science is this settled, why has consumption barely moved? Because settled science and changed behaviour are separated, historically, by decades — and the length of that lag is a function of how hard entrenched interests work to preserve the status quo.

The pattern rhymes with two transitions investors already understand. Tobacco: the link to cancer was established in the 1950s, yet consumption in the West only declined in earnest a generation later, after the cultural and regulatory tide finally turned. The combustion engine: the case for electrification has been clear for years, and yet incumbents, supply chains and habit are stretching the transition for way too long.

Recent academic work documents how parts of the meat-and-dairy sector have borrowed from the tobacco and fossil-fuel “playbook” — funding sympathetic voices, manufacturing doubt around inconvenient findings, and lobbying to keep uncomfortable conclusions out of government policy.18

By 2025, seven US states — Alabama, Florida, Indiana, Mississippi, Montana, Nebraska and Texas — had passed bans on the production, sale or distribution of cultivated meat, several of them explicitly framed as protecting conventional ranchers.19

Europe has moved in the same direction. In the UK, the only cultivated meat cleared for sale so far is for pets, not people: human approval is still working its way through the Food Standards Agency.20 In November 2023 Italy became the first country in the world to ban the production and marketing of cultivated meat outright — a law championed by Giorgia Meloni’s government as a defence of “national culinary heritage”, with fines running up to €150,000; the same law restricted “meaty” terms such as steak and salame on plant-based packaging. Hungary followed in November 2025, banning cultivated meat, and, tellingly, in the same parliamentary session, cutting VAT on beef from 27% to 5%.21

In late 2025 it was the European Parliament to restrict everyday “meaty” words — burger, sausage, steak — from being used on plant-based packaging, despite objections from supermarkets, producers and the EU’s own consumer-research body, whose surveys found shoppers are not in fact confused by a clearly labelled “veggie burger.” A full ban could become EU law within a couple of years, with the UK potentially following via its food-trade alignment with Brussels.22 Nobody mistakes a mince pie for mince, but the episode is a vivid, present-tense illustration of exactly the kind of regulatory friction our tobacco parallel describes.

Nor does the engineered meat’s “ultra-processed food” (UPF) label help. Under the current system, most plant-based meats fall into the same group (UPF) as industrial biscuits or hot dogs — but that classification turns on the degree of processing, not on nutritional content, and peer-reviewed work argues it wrongly lumps together foods with very different health profiles. A soy burger with added vitamin B12 and iron has clearly a better nutritional profile than a traditional pork sausage, yet both fall into the same UPF category. This is the paradox that the meat lobby exploits: since 2019, industry-funded groups have run high-profile campaigns branding plant-based meat as “chemical” and “ultra-processed.”23

Having said all that, in food the lag between science and behaviour could prove shorter than in tobacco or the combustion engine. Today, cheaper and more accessible information — accelerated by the internet and increasingly by artificial intelligence — spreads awareness of the health and environmental costs much faster than in any previous transition.

And a further force could shorten the lag between science and consumer behaviour even more.


Food security: a potential new driver?

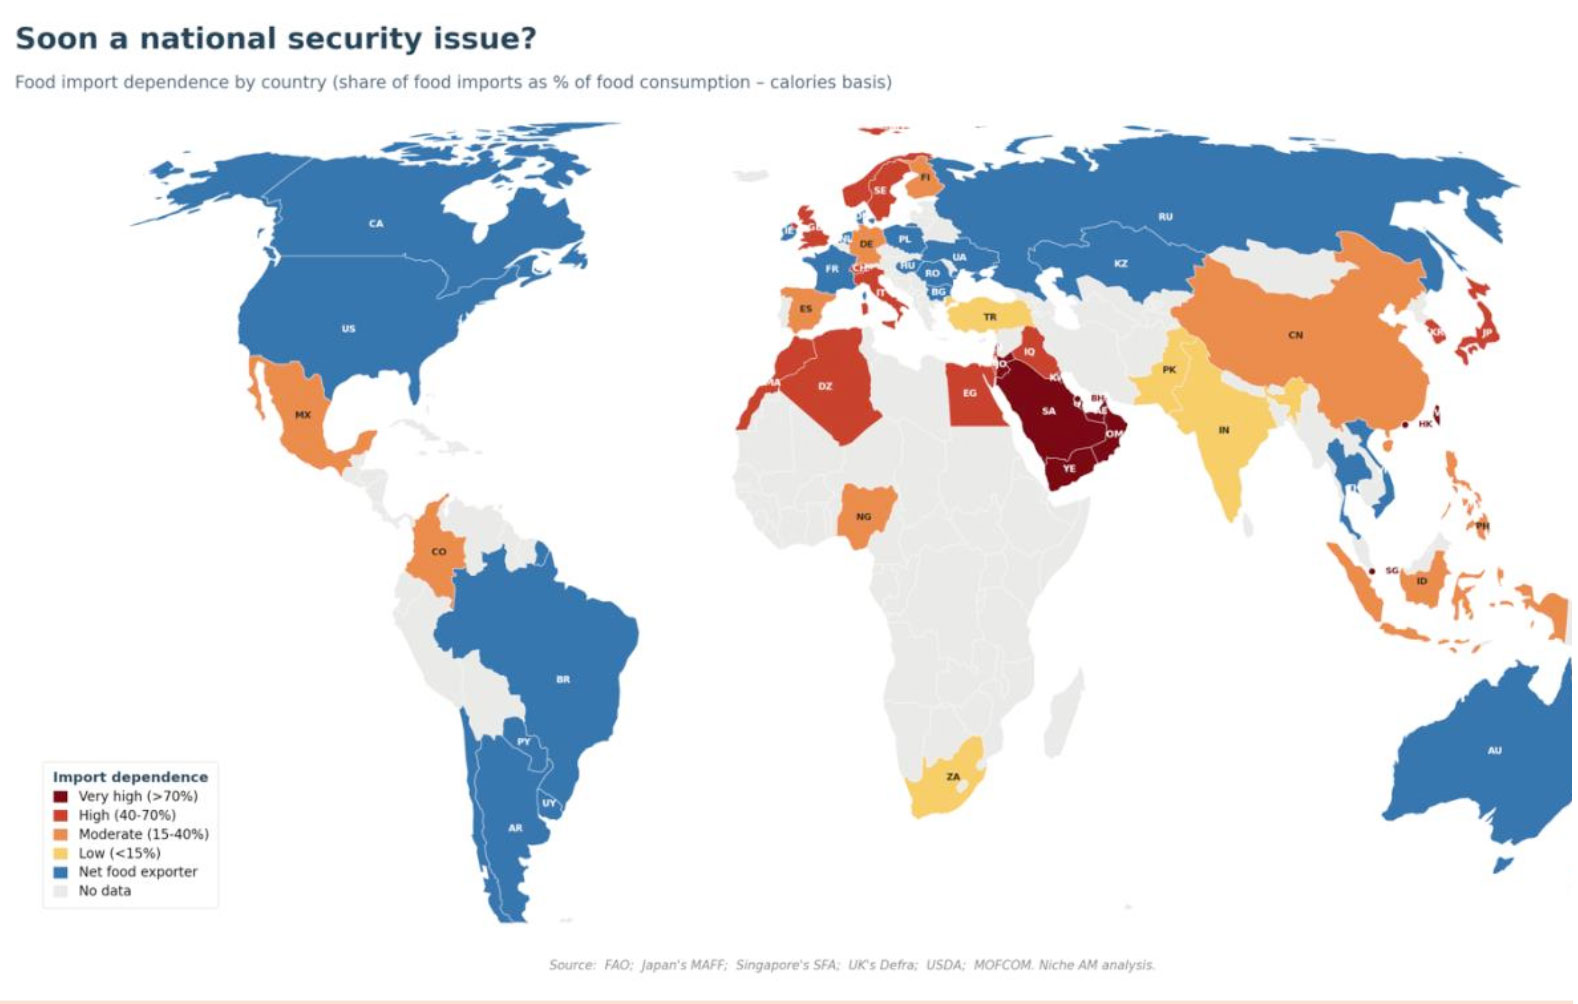
For now, government policy is mostly a brake on this shift, not an accelerant — which is part of why the gap between the science and consumption stays so wide. But that could change, and not for moral or ideological reasons. Sooner or later, governments may start treating protein the way they learned to treat oil and gas, i.e.: as a strategic resource to be secured. Any country that imports a large share of its food has an incentive to diversify how that protein is produced — and the market is pricing none of this today.

China is the clearest illustration. As incomes rose, its animal-protein consumption climbed sixfold between 1980 and 2020; its food self-sufficiency has fallen substantially since 2000 on most measures, and it now imports roughly a third of key food commodities.24 A leadership that has named food security a pillar of national economic security is unlikely to leave more than a billion “rice bowls” dependent on foreign soybean fields indefinitely.25

The import dependency runs deeper than soybeans. Feeding animals at scale also relies on imported nitrogen and phosphate fertilisers, whose supply is concentrated in a handful of geopolitically exposed producers — Russia and Belarus chief among them. Eating plant protein directly cuts out an entire tier of that fertiliser-intensive feed demand.

The shift towards alternatives is therefore not only a bet on scarce farmland, but on agricultural-input sovereignty. And in fact, China is now the world’s biggest public funder of agricultural R&D and a leader in cultivated-meat patents. We flag this not because we invest in China — we do not — but because it is the largest single signal that protein could soon become a strategic question rather than a wellness one. Nor is this a uniquely Chinese policy impulse. It is telling that Israel and Singapore — both small, acutely import-dependent economies — were among the first to approve cultivated meat for sale for human consumption.26

The key point for an investor is simply that a durable, state-backed sponsor of protein diversification would be a far more powerful force than any consumer fad — and one the market has not even begun to price.27

A brief overview of the alternatives to meat

Alternatives to meat are far wider than laboratory burgers. The most investable substitute today is simply fish and seafood, followed by vegetables, legumes and dairy.

Fish enjoys a structural advantage the rest of the protein complex lacks. Unlike red meat, it faces no carcinogenicity findings, or “meaty name” bans, and retains a broadly healthy reputation. At the same time the wild-caught supply is increasingly constrained — by vessel-fuel costs, by tightening catch quotas, and by warming, shifting fish stocks — which tightens supply precisely as demand for healthy protein grows.

Beyond fish, vegetables, legumes and dairy sit the three engineered routes people usually have in mind. Plant-based meat products use proteins, fats and fibres from crops — soy, peas, wheat — shaped to mimic the taste and texture of meat; this is the category that boomed and busted in 2019–2024. Fermentation uses microorganisms, in the same kind of vessels breweries use, to make proteins and fats directly. Cultivated (or cell-cultured) meat grows real animal muscle and fat cells in bioreactors, without raising or slaughtering an animal.

Cultivated meat is the earliest-stage and most capital-intensive of the three, but the peer-reviewed evidence on its potential is striking: the first study built on real cultivated-meat company data found the process could cut climate impact by up to 92%, air pollution by up to 93% and land use by up to 95%, measured against conventional beef produced with renewable energy.28

The first cultivated beef burger was unveiled in London in 2013 — a scientific proof-of-concept, not a commercial product, since regulatory approval is still pending.29

Its widely cited cost of roughly €250,000 was clearly not the price of a hamburger but the cost of the entire research programme behind that first prototype. Mark Post’s team at Maastricht University had to develop the technique from scratch: culturing bovine muscle stem cells and growing them into thousands of tiny muscle fibres. All of this at laboratory scale, with no economies of scale, involving years of skilled researchers’ work and expensive culture and lab equipment. The project was funded by Sergey Brin, co-founder of Google.

Cultivated meat is today approved for human consumption only in Singapore (2020), the United States (2023), Israel (2024), Hong Kong (2024), Australia (2025) and New Zealand (2025).

Edible insects represent another viable alternative protein source. Typically fed on organic waste, they are processed into nutrient-dense flours and oils. Right now they are not aimed at the Western dinner plate: in Europe and the US, insect protein is today overwhelmingly a feed ingredient, replacing fishmeal and soy in aquaculture, poultry and pet food, and it reaches people only as a milled flour in snacks and baked goods — though whole insects have been eaten across Asia, Africa and Latin America for centuries, by an estimated two billion people.30

The obstacle in the West, of course, is not nutritional or health-related but cultural. Insects carry none of the health problems identified for meat earlier in this paper, and there is nothing engineered about them (i.e.: no cells, no bioreactors, etc). They are arthropods, not red meat: there is no evidence linking arthropods to cancer, heart disease or type-2 diabetes. The one established caveat is allergy — people who react badly to prawns and shellfish may react to insects too, and EU labels are required to say so. That caveat is itself revealing: insects are close relatives of shrimp and crab, and the human immune system cannot reliably tell a cricket from a prawn. Only culture can.31

The same Western palate that recoils at a grasshopper pays a premium for the fattened liver of a force-fed goose, for snails in garlic butter or for the tripes of a ruminant. In Mexico, that hierarchy is simply inverted: chapulines are a street snack sold by the basket in Oaxaca’s markets but escamoles — ant larvae, known as “Mexican caviar” — are served in the country’s finest restaurants at roughly the price of a high-end steak.32

Taboos of this kind are constraints on demand, but they are also historically unstable and could be transitory. Lobster is the obvious reminder: for two centuries colonial New Englanders despised lobster as fertiliser and fish bait — it was called “the cockroach of the sea,” disdained precisely because it looked like a giant insect. The same creature, unchanged, is now one of the most expensive items on the menu. What changed was not the animal. It was us.33

For our purposes, the investment case for the No Meat’s Land niche does not require anyone to eat laboratory-meat or insects. If these never reach a Western plate, our cheap and cash-generative fish, dairy and vegetable holdings are entirely unaffected. In fact, right now, both alternative-meat and insects remain almost entirely private businesses, and we are exposed to neither of them — yet we follow the sectors closely and may invest as and when listed (and attractive) opportunities emerge.


Even Big Meat is hedging

This is not an investment case for chemically engineered-meat. The most investable substitutes to meat today are the everyday ones: fish and seafood, dairy, vegetables and legumes, which are the areas where we are currently invested in the No Meat’s Land niche. Seafood and dairy alone are each markets in the region of a trillion dollars, against a meat market of roughly $1.7tn. Only beyond them sit the three engineered routes people usually have in mind (i.e.: plant-based, fermentation-based and cell-based meat) — together barely $14bn today.

This is not a thesis against Big Meat either.

Even the alternative-meat field is populated by more than 600 companies, most of them small and private, but some of the world’s largest conventional meat and food companies are themselves investing in the alternatives: JBS, the world’s largest meat producer, has funded a cultivated-meat division and bought the Dutch plant-based Vegetarian Butcher business from Unilever, and the three largest meat companies and two largest food companies are all now investors in plant-based or cultivated protein.34

The cultivated-meat field has also drawn capital from innovators such as Bill Gates and Richard Branson and from other established players such as Tyson Foods and Cargill. The same names are also backing insects: in 2023 for example Tyson Foods took a minority stake in the Dutch black-soldier-fly specialist Protix and announced a joint venture to build an insect-ingredient plant in the United States, its larvae to be reared on by-products from Tyson’s own slaughterhouses.35

We expect therefore the traditional food majors to play a central role from here, steadily transitioning their operations towards alternative products.

The motivation is unlikely to be green — it is profits and risk management, as alternative meat carries fewer supply-chain risks (from animal-disease epidemics to tightening environmental rules). We take this as a useful corroborating signal: this is not an ideological thesis at odds with the meat industry, but a direction in which the meat industry’s own capital is already, quietly, flowing.

As for the scale of the opportunity, sell-side and consultancy estimates have put alternative-meat’s potential share of the conventional meat at around 50% by mid-century.36 Today that share is tiny: in the US for example, plant-based meat is only about 1% of the retail meat market. We treat the 50% figure as illustrative of the size of the opportunity rather than a number we are underwriting; our discipline is to own cheap, cash-generative businesses today, not to forecast a market share three decades out.

How we play it

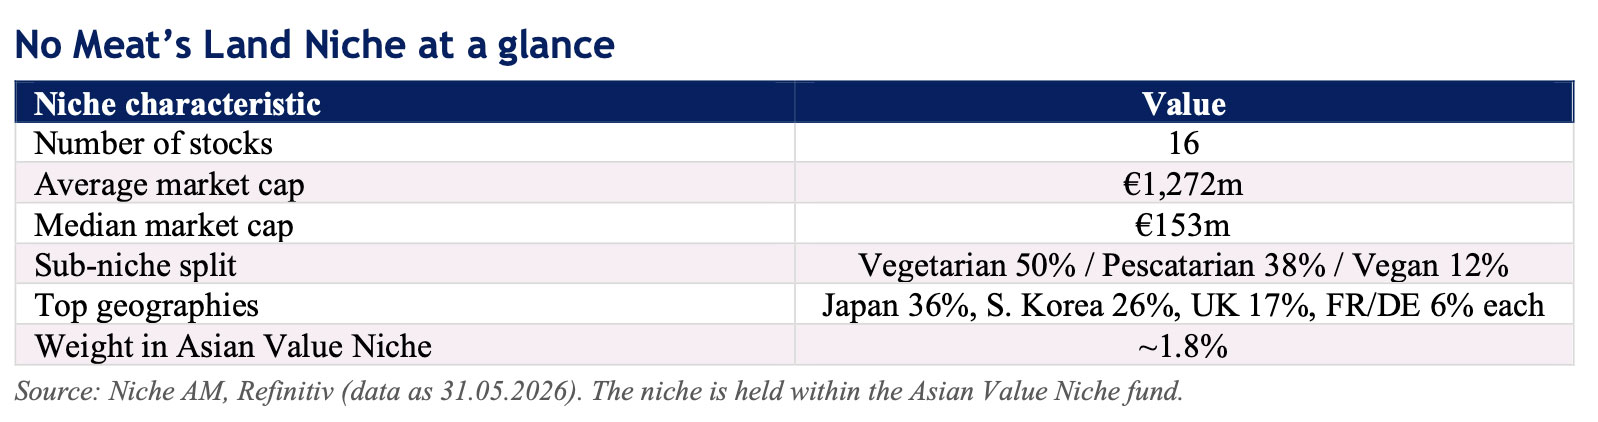
A word on what these data mean in practice in terms of investment strategy. We are deep-value investors: we buy cheap, profitable, asset-backed businesses, and it happens that a cluster of them today sits in the vegetarian, pescatarian and vegan corners of the food world. We are not trying to own the next imitation burger — in fact we own no pure “alternative-meat” stock at all right now, because we see no deep-value opportunity among them in public equities. The companies that blew up in 2021 were, for the most part, loss-making, cash-burning and priced for a future that didn’t arrive. The No Meat’s Land niche, held within our Asian Value Niche fund, instead holds a tightly diversified basket of profitable, asset-rich, often net-cash, dividend-paying businesses across three sub-niches — vegetarian, pescatarian and vegan — bought at multiples that reflect neglect rather than the quality of the underlying assets.

Many of our holdings trade below tangible book (i.e.: the value of inventory, real estate or fishing fleets). Korean fishing group Silla for example trades at around 0.3x tangible net assets, with cash and investments worth more than twice its market capitalisation. In other words, these are not concept stocks: they are cheap, real businesses that happen to sit on the right side of a long structural trend.

Consistent with our house style, the niche is highly diversified by holding (16 names today, with new ones added and others retired as valuations normalise) and — importantly — liquid. It is one of fifteen uncorrelated niches inside the Asian Value Niche fund, where it currently represents a deliberately small weight: enough to matter when the theme re-rates, small enough to be patient while it does not.

Why now?

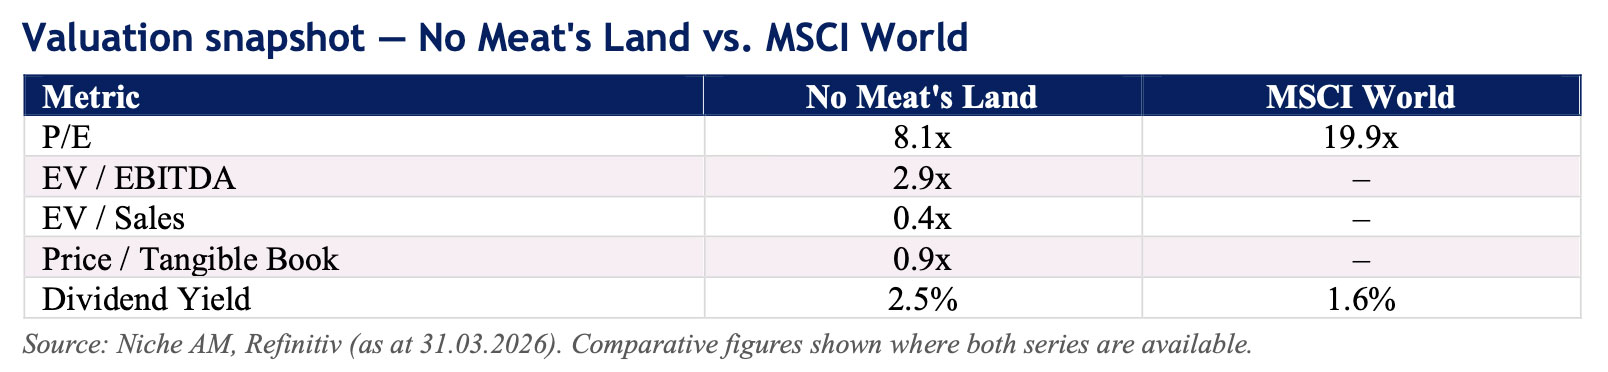
Why should 2026 be the entry point rather than next year, the year 2030 or any other time in the future? We are not in the business of timing perfect entry or exit levels. We buy when stocks of fundamental sound businesses with favourable trend dynamics trade at deeply discounted valuations. And for the alternatives-to-meat niche that time is now. The niche hype is gone, the speculative names have de-rated by 80–90% and the speculators and momentum traders have left – we are buying into neglect, not euphoria: the niche trades at around eight times earnings, below tangible book, on a dividend yield well above the market — about the cheapest the theme has been since it existed.

Conclusion

We are not telling anyone what to put on their plate, and this is not an ESG thesis dressed as research. We are not making the investment case for alternative meat either — we own none of it right now: we are making the case for the stocks of businesses producing alternatives to meat, which include fish, vegetables, legumes and dairy, as well as chemically engineered meat-alternatives.

Our thesis rests on health economics, the biology of raising animals, geopolitics and above all, valuation. The market has thrown out a structurally important theme along with the speculative excess that briefly surrounded it; what is left is cheap, profitable, and — in the not-too-distant future — quite possibly backed by security of supply objectives as well.


Risks to the thesis

Three developments could, in principle, erode some of the structural pull away from meat. In each case the evidence is real but partial — and, importantly, the thesis downside is anyway limited by the type of stocks we own: cheap, profitable, asset-backed, often net-cash businesses bought below tangible book. That margin of safety does not depend on any forecast about any source of protein in 2050.

1. Methane-reducing feed additives could reduce the climate cost. A group of selected additives and red seaweed have been found to be effective in cutting enteric methane to a significant degree. Yet these seem to work mainly in confinement systems, red seaweed cannot yet be farmed at anything like the scale required, and additives incur costs with no revenue offset absent carbon incentives. They also address only climate, leaving the health, land-use and feed-economics drivers untouched.37

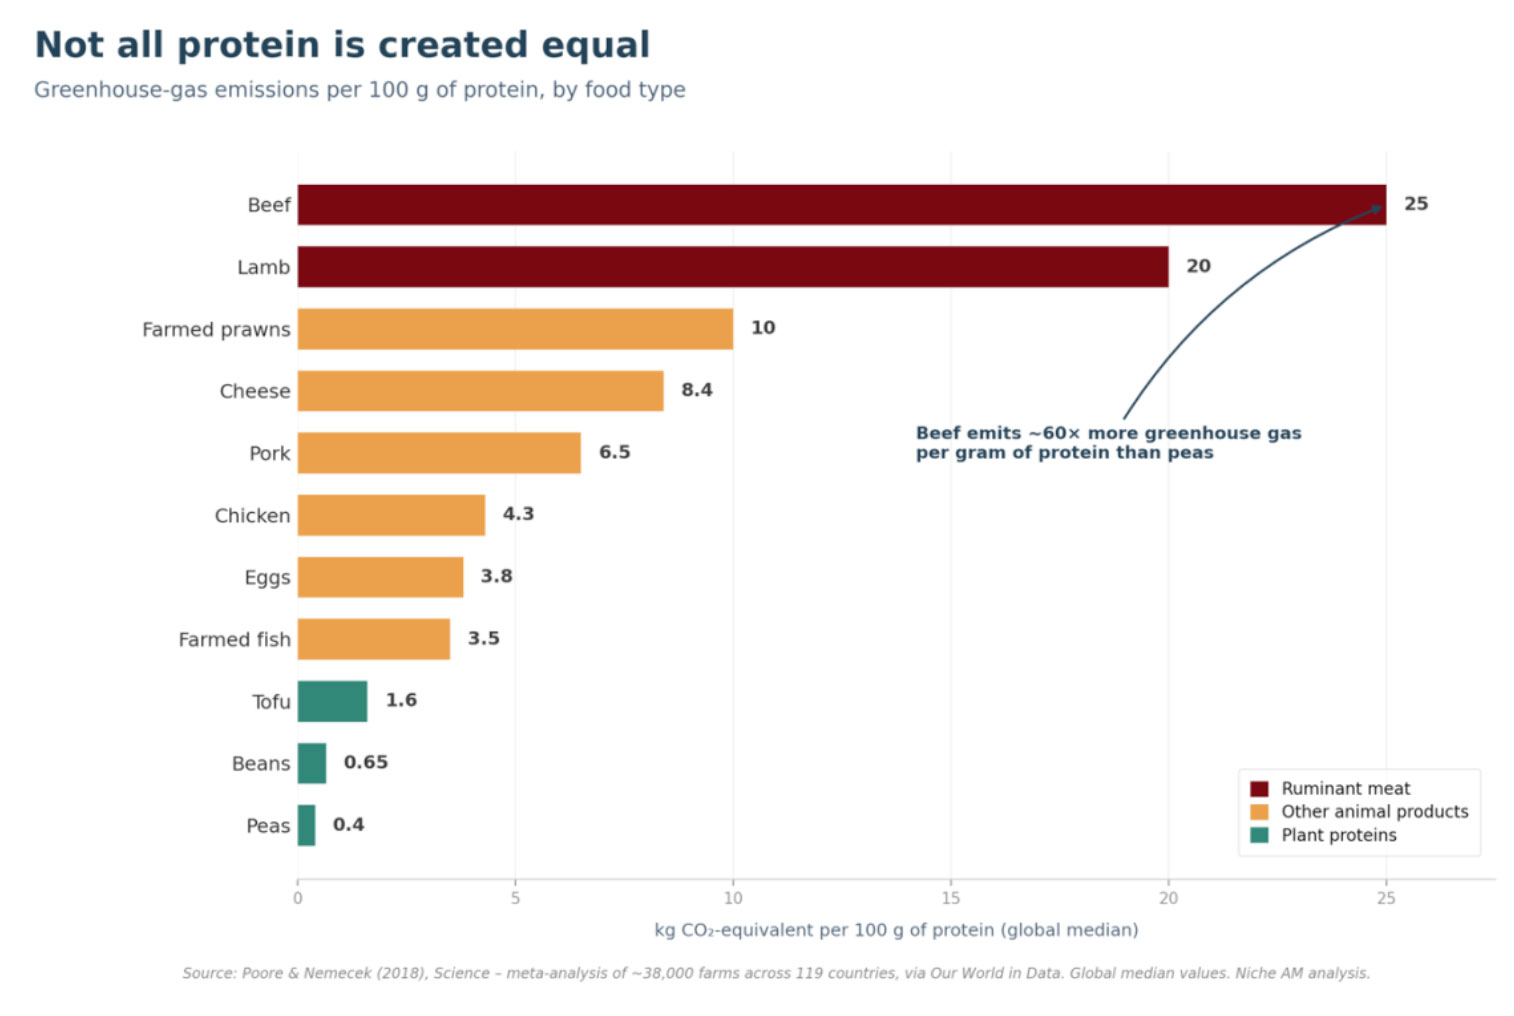
2. Beef productivity could improve further. Genetics, feedlot efficiency and reproductive technology have made beef steadily cheaper and cleaner per kilogram: the FAO estimates the emissions intensity of beef fell ~38% between 1961 and 2022, US herd numbers dropped from ~135m head in the 1970s to ~90m today while producing more beef than it did then; and American ranchers now produce a fifth of the world’s beef with less than a tenth of the world’s cattle.38 If beef keeps closing its cost and footprint gap, the structural pull weakens. Yet our thesis would still hold: efficiency lowers emissions intensity per kilo but not absolute emissions, which keep rising with population and demand growth; it does nothing for the health and carcinogenicity evidence; and the gap between beef and a plant protein is so large (roughly 30-to-1 on feed, ~60-to-1 on emissions per gram of protein) that even large incremental gains do not close it enough.

3. Alternative meat and/or insects never reach commercial scale. Possible — but irrelevant to what we own. Some studies have identified biological and engineering bottlenecks for cultivated meat for example, such as slow cell-doubling times, bioreactors constraints and dependence on scarce high-purity media.39 Consumers also seem to be rejecting alternative-meat products for the time being, with plant-based meat being for example only ~1% of the US retail meat market. Taste, price and the “ultra-processed” label of alternative-meat may remain real barriers. Finally, regulation may stay hostile rather than turning supportive. Yet our No Meat’s Land niche owns no alternative-meat or insect stocks — if those businesses never scale, our cash-generative fish, dairy and vegetable holdings are entirely unaffected.


Sources & notes

1 YouGov/The Economist

2 In Europe the gap is closing faster: branded vegan meat still carries roughly a 25% premium, but private-label ranges have reached outright price parity. Lidl Germany aligned the prices of most of its Vemondo private-label plant-based range with comparable animal products in October 2023, with a resulting uplift of over 30% in plant-based sales (Lidl, 2024).

3 Fox News; CBS News; Food Safety Magazine, Jan–Feb 2026.

4 Good Food Institute; Food and Agriculture Organization of the United Nations (2019)

5 Excluding the moral dimension from our investment thesis should not be read as indifference to it. We are not unsympathetic to the ethical questions raised by animal farming — in particular the treatment of livestock under industrial confinement. For a treatment of the moral case, with specific reference to the conditions in which pigs are raised, see Noah Smith, “The Way We Treat Pigs Is a Sin,” Noah Smith, 31 May 2026.

6 These classifications describe the strength of the evidence that something can cause cancer, not the magnitude of the risk: bacon is not as dangerous as cigarettes.

7 WHO/IARC (2015) and subsequent reviews. The Economist, “Is red meat unhealthy?” (March 2025).

8 Drabik-Markiewicz, Dejaegher, De Mey, Kowalska, Paelinck & Vander Heyden, “Influence of putrescine, cadaverine, spermidine or spermine on the formation of N-nitrosamine in heated cured pork meat,” Food Chemistry 126 (2011); De Mey et al., “Evaluation of N-Nitrosopiperidine Formation from Biogenic Amines During the Production of Dry Fermented Sausages,” Food and Bioprocess Technology (2013); Del Rio et al., Scientific Reports 9 (2019); EFSA Panel on Biological Hazards, “Scientific Opinion on risk-based control of biogenic amine formation in fermented foods,” EFSA Journal (2011).

9 Nature Medicine (2026)

10 University of California, San Francisco randomised-controlled trial (2019): red-meat diet raised cholesterol and TMAO (trimethylamine-N-oxide) versus a matched meat-free diet.

11 Bastide et al., Cancer Research (2015); WCRF/AICR Continuous Update Project. Micha, Wallace & Mozaffarian, Circulation (2010, updated 2012); Lancet Diabetes & Endocrinology (2024)

12 Van Boeckel et al., “Global trends in antimicrobial use in food animals,” PNAS 112 (2015); Van Boeckel et al., Science 365 (2019); Review on Antimicrobial Resistance (O’Neill, 2016); Farm Animal Investment Risk & Return Initiative

13 Gerber et al., FAO 2013; FAO 2022; Poore & Nemecek, Science (2018), Xu, Sharma et al., “Global greenhouse gas emissions from animal-based foods are twice those of plant-based foods”, Nature Food 2 (2021)

14 IPCC AR6; FAO. Feed additives that reduce the methane cattle produce can blunt part of the climate cost. Seaweed-derived compounds for example are said to cut enteric methane by roughly 37% in grazing-cattle trials, and more under controlled feeding (Meo-Filho et al., PNAS 2024). We treat this as an offset to the climate cost of animal feed — and a risk to the thesis.

15 Bruce Friedrich, The Guardian (31 Jan 2026); Financial Times (18 Feb 2026)

16 Poore & Nemecek, Science 360 (2018), meta-analysis of ~38,000 farms across 119 countries; Our World in Data.

17 Mekonnen & Hoekstra, “A global assessment of the water footprint of farm animal products,” Ecosystems 15 (2012). Green water (rainfall) accounts for the great majority of the beef figure; the blue-and-grey footprint alone is roughly 925 l/kg.

18 Stat (2026)

19 National Agricultural Law Center, “Alternative Protein Laws: State Compilation” (2025–26); Food Safety Magazine (June 2025); Upside Foods / Institute for Justice

20 UK’s Food Standards Agency (2024), UK’s Food Standards Agency (2025), UK’s Department for Environment Food and Rural Affairs (2024); UK’s Animal & Plant Health Agency (2024)

21 Bloomberg, “Italy Bans Lab-Grown Meat” (16 November 2023); Legge 1 dicembre 2023, n. 172, artt. 2, 3 e 5; Osborne Clarke, “Italy bans lab-grown meat, violating EU procedure” (2024); Hungarian National Assembly (18th November 2025)

22 Financial Times (5 Jan 2026): EU parliament voted to restrict “burger,” “sausage,” “steak” and similar terms for plant-based products; BEUC consumer research found shoppers understand clearly labelled vegetarian/vegan products; Aldi, Lidl and Burger King opposed the move; UK SPS alignment with the EU could extend the rule.

23 Messina & Messina, “Nova fails to appreciate the value of plant-based meat and dairy alternatives in the diet,” Journal of Food Science (February 2025). See also Bryant Research, “The Ultra-Processed Myth” (2024).

24 China’s Ministry of Commerce; Reuters; USDA Foreign Agricultural Service (Dec 2025/Jan 2026).

25 Adam Tooze, Financial Times (2 May 2026); Bruce Friedrich, cited in Damian Carrington, The Guardian (31 Jan 2026); Ryan Huling, Los Angeles Times (17 March 2026): food security described by Xi Jinping as “a foundation for national security” and as “pillar of national economic security” in the 14th Five-Year Plan of 2021.

26 Caitlin Welsh, Center for Strategic and International Studies, in foreword to Bruce Friedrich’s Meat (2026).

27 China became the largest public funder of agricultural R&D after 2011, spending over $10bn a year by 2015 — roughly twice US expenditure (USDA Economic Research Service). Of the top 20 cultivated-meat patent applicants, eight are Chinese public institutions, mostly universities (Zhejiang, Jiangnan, Ocean University of China); Chinese public institutions have filed more cultivated-meat patents than those of the US and Europe combined (Good Food Institute APAC, 2025).

28 Sinke, Odegard et al., A life-cycle assessment of cultivated meat, CE Delft, GAIA and The Good Food Institute (2021)

29 G. Owen Schaefer, “Lab-grown meat,” Scientific American (2018), Pallab Ghosh, “World’s first lab-grown burger is eaten in London,” BBC, August 5, 2013

30 FAO, Edible Insects: Future Prospects for Food and Feed Security (2013); International Platform of Insects for Food and Feed (IPIFF) https://ipiff.org/

31 EFSA Panel on Nutrition, Novel Foods and Food Allergens, safety opinions on Tenebrio molitor, Locusta migratoria, Acheta domesticus and Alphitobius diaperinus (2021–2023).

32 Ramos-Elorduy, on Mexican entomophagy; FAO (2013).

33 William Wood, New England’s Prospect (1634); Sandy Oliver, food historian, cited in Boston.com (2023), who notes that the widely repeated claim that lobster was contractually rationed to servants and prisoners has no contemporaneous documentary basis.

34 Bloomberg, The Guardian (31 Jan 2026)

35 That US plant is now on hold, and the wider insect-farming sector has been through a brutal shakeout — Ÿnsect, once the largest player in the field, was liquidated in late 2025, and Innovafeed suspended its US pilot after eighteen months. Protix has meanwhile pivoted towards South-East Asia and South Korea, where feedstock rules are looser and operating costs far lower. Sources: Tyson Foods press release (17 October 2023); AgFunderNews, “Protix targets Asia as Tyson-linked US insect ag project stalls” (April 2026)

36 McKinsey: Alternative proteins: The race for market share is on (2019); Barclays (2019); Credit Suisse Research Institute (2021)

37 Van Gastelen et al. Penn State / Kebreab (2021–2024); Elanco/FDA approval (May 2024); Roque, Venegas, Kinley, Kebreab, PLOS ONE (2021); Kebreab et al., PNAS (2024).

38 Benjamin Goren, “More and More, Beef (And Less Climate Impact)”, The Breakthrough Institute (21 November 2024), drawing on FAOSTAT emissions-intensity data and the 2022 US Census of Agriculture; Capper, International Journal of Life Cycle Assessment (2018) on US productivity gains 1977–2007.

39 Humbird, “Scale-up economics for cultured meat”, Biotechnology & Bioengineering 118 (2021); Negulescu et al., Biotechnology & Bioengineering 120 (2023); review in Nature Food (2024).


Legal disclaimer

This document, together with any presentation and related material, is intended exclusively for marketing and information purposes. It is not a legally binding document, contains no representation and does not constitute an offer or invitation to invest in any of the funds of Niche Asset Management Ltd. (the “Fund”). Furthermore, it does not constitute a solicitation for any such offer or invitation, nor may it be regarded as part of it or of its distribution in connection with any contract relating to the Fund. This document, any presentation made in conjunction with this document and any related material are preliminary and for information purposes only. They do not constitute an offering memorandum, contain no representation and neither constitute nor form part of an offer or invitation to subscribe for any of the Niche funds (each, the “Fund”). Furthermore, they neither constitute nor form part of any solicitation of such offer or invitation, nor do they (or any part of them), nor the fact of their distribution, form the basis of, or may be relied upon in connection with, any contract relating thereto. The information contained in this report document has been compiled solely by Niche Asset Management Ltd (known as “Niche AM”), authorised and regulated by the Financial Conduct Authority (RN783048) and registered in England and Wales 10805355. The information and opinions contained in this document are not intended to be complete and may be subject to change at any time. No representation, warranty or undertaking, express or implied, is given as to the accuracy of the information or opinions contained in this document, and Niche Asset Management Ltd and/or its partners accept no liability for the accuracy and completeness of the information. Investments in the funds are subject to market risks, including the potential loss of capital.

The Fund’s investment strategy is speculative and entails a significant risk of losing part or all of the capital invested. Market, political, counterparty, liquidity and other risk factors may have a significant impact on the Fund’s investment objectives, while past performance is neither a guide to nor indicative of future results. The distribution of this document and the offering of the Fund’s units may be restricted by law in certain jurisdictions, and accordingly anyone coming into possession of this document should be aware of and comply with any applicable laws or regulations. Niche AM’s funds are not yet available for distribution in all countries. Prospective investors are invited to contact Niche AM to verify the countries of registration. Any failure to comply with these restrictions may constitute a violation of the laws of such jurisdiction. The reproduction of this information, in whole or in part, without the prior consent of Niche AM is also prohibited. This document may be communicated or passed only to persons to whom Niche AM is permitted to communicate financial promotions pursuant to an exemption provided under Chapter 4.12 of the Conduct of Business Sourcebook (“COBS”) (“Permitted Recipients”). Furthermore, no unauthorised person may communicate this document or otherwise promote the Funds or the units therein to a person in the United Kingdom, unless that person is (a) a Permitted Recipient (b) a person to whom an authorised person is permitted to communicate financial promotions relating to the Fund or to promote the Fund under the COBS 4.12 rules applicable to that authorised person. The securities mentioned in this document have not been registered under the Securities Act of 1933 (the “1933 Act”) or under the securities laws of any other US jurisdiction.

Such securities may not be sold or transferred to US persons unless such sale or transfer is registered under the 1933 Act or exempt from such registration. This document is a marketing communication intended exclusively for professional investors. Prospective investors are advised to read carefully the Prospectuses and the Key Investor Information Documents (KIID) for all details, including risk factors and fees, before making any final investment decision.

Prospectuses, supplements, KIIDs and a Summary of Investor Rights are available free of charge at https://nichejungle.com/regulatorydocuments and at https://nicheam.com/legal.

This is a marketing communication intended exclusively for professional investors. Please refer to the Funds’ Prospectuses and the KIDs before making any investment decision.

Do you enjoy our Niche Insights? Read more here

Follow us on LinkedIn


Niche Asset Management Limited
Authorised and regulated by the Financial Conduct Authority
17 Lennox Garden London SW1X 0DB – Registered in England – No. 10805355


Read More
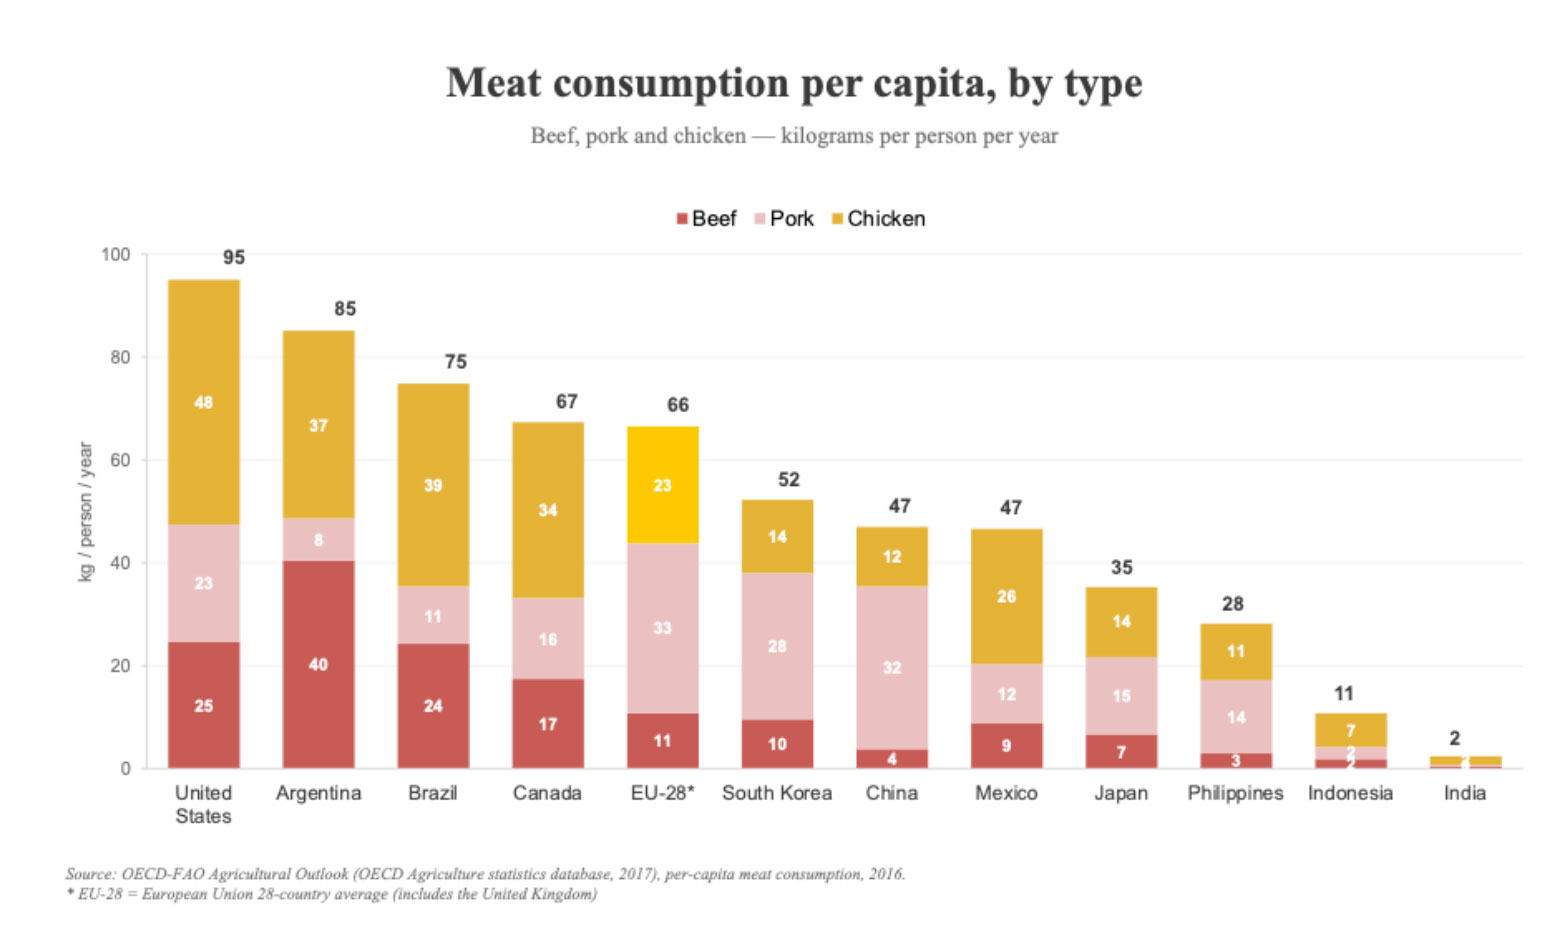
24
Jun
2026
When a bubble bursts, not everything bursts
Posted On June 24, 2026  By admin  And has No Comment

The 2000 precedent justifies active management, far from the indices

On 12 June 2026, SpaceX made its Nasdaq debut in the largest IPO in history. A company with roughly USD 19 billion in revenues and a net loss of nearly USD 5 billion was priced at around USD 1,750 billion and, in its first days of trading, rose above USD 2,300 billion: roughly 120 times revenues.

Episodes like this have rekindled the fear that such euphoria signals an imminent peak in the technology cycle. Yet when someone points this out, the objection is almost always the same: “anyway, if the tech bubble bursts, everything collapses”.

This assumption is wrong.

The objection implicitly has 2008 in mind. But 2008 was a bubble at the very heart of the financial system — in bank credit and leverage: a systemic and liquidity crisis. That is why, when it burst, correlations went to 1 and almost everything fell together. Today’s bubble is of a different nature: it lives within a sector, not in the financial foundations of the system.

There is a reason 2008 comes to mind first. Kahneman and Tversky called it the availability heuristic: we judge the probability of an event by the ease with which we recall an example of it, and the most recent and vivid examples are the most available. 2008 — systemic, traumatic, lived through on the markets — occupies that space; 2000 is more distant and more faded.

To this is added a demographic fact: a large share of those who today manage or advise on portfolios did not live through 2000 first-hand — they were at school or university — whereas they experienced 2008 at the start of their careers. The precedent that matters is also the one missing from the professional memory of much of the industry.

But it is the wrong precedent. Today’s bubble is concentrated on a single theme — technology, and AI in particular — within an otherwise solid financial system. It resembles 2000 far more than 2008.

And 2000 tells a different story. The burst was concentrated on technology and telecoms; capital rotated from the “new economy” towards the “old economy” — value, defensives, cyclicals. Correlations between sectors stayed low and several segments rose while the Nasdaq collapsed.

If 2000 is the relevant precedent, what matters is not how far the index will fall when the current bubble deflates, but how the sectors and styles that have nothing to do with that theme will behave.

In the period immediately following the Nasdaq’s 2000 highs — the first twelve months of the bubble’s deflation1 — not all sectors collapsed: some, in fact, rose, offering investors generous returns.

United States. In the twelve months from the peak, the Nasdaq-100 lost 63% and the S&P 500 22%, dragged down by technology (−60%) and telecommunications (−37%). But outside the bubble the picture reverses: utilities and consumer staples gained almost 35%, insurance almost 25%, transport 24%, healthcare 17%, banks and energy over 10%. A portfolio built on these segments would have closed the year strongly in the black.

Japan. The same story, even more extreme. The TOPIX lost 19%, with electronics at −24% and IT & Telecom at −45%. But the rest of the market tells a different tale: oil & coal (+59%), mining (+50%), insurance (+42%), utilities (+33%), real estate and land transport above 17%. The rotation was even more pronounced than in the United States.

Europe. The same dynamic is found here too. The Stoxx Europe 600 lost 20%, dragged down by technology (−54%), telecommunications (−54%) and media (−46%). But outside the bubble the picture changes: oil & gas and healthcare both gained around 12%, banks over 8%, while basic resources and chemicals closed in positive territory. The gains were more modest than in the United States and Japan, but the separation between technology growth and everything else was just as clear-cut.

Utilities, pharmaceuticals, staples and the other sectors rose because they offered stable dividends, predictable cash flows, attractive valuations and low correlation with the technology cycle. In a flight to safety, the capital leaving the “new economy” sought refuge in what was tangible and profitable — real earnings, not promises of earnings or of eternal, exponential earnings growth. The same dynamic could repeat itself when stocks like SpaceX or the Mag 7 return from the stratosphere towards Earth.

It is not only a story of sectors, but also of styles. Using the Fama-French factor portfolios, in the twelve months from the 2000 peak growth collapsed by 34%, while value gained 17% and high-dividend stocks 32%. Quality held up, at −1%


Index ≠ portafoglio

It is true that today’s main indices are extremely concentrated in Technology. In the S&P 500, Technology alone carries a weight of around 34% — at all-time highs — and together with Communication Services (which since 2018 has gathered the former telecoms alongside giants such as Alphabet, Meta and Netflix) approaches 44%. In the Nasdaq 100, Technology weighs around 57% and, with Communication Services, exceeds 70%. In the MSCI Emerging Markets, technology approaches 45%.

The bursting of the Technology bubble would therefore also pull the indices down heavily. But the indices are not the market — and, above all, they should not be investors’ portfolios. Especially today, with indices showing such extreme levels of concentration.

The central question, then, should not be “how far will the index fall”, but “how far will the portfolio fall”. They are the same thing only if the portfolio replicates the index. In the 2000 bubble, an active allocation built by sectors and stocks — underweighting the segments at extreme valuations and favouring defensives, value and less crowded exposures — would have come through the downturn with far smaller losses, in several cases closing in profit.

The cost of indexation is not only the potential depth of the fall, but its duration. The stocks at the centre of the euphoria, when the bubble bursts, can take a decade or two to revisit their highs — assuming they revisit them at all. The Nasdaq Composite returned to its March 2000 levels only in 2015, fifteen years later; many of the protagonists of that era took just as long, or never recovered. Those who stay anchored to the concentrated index do not merely suffer its decline: they wait years for its recovery.

The “everything collapses” assumption is not only wrong: it is also a cause of inertia. If everything really did fall, seeking alternatives would make no sense — one might as well endure the decline. And this inertia would be the most insidious consequence. It encourages not moving the portfolio, not underweighting the most expensive segments, not seeking the exposures that have nothing to do with the technology theme. But 2000 shows that those alternatives exist — and that they must be sought, because by replicating the index one does not find them.

The consequences of a bursting of today’s Tech bubble probably would not stop at the equity markets. If and when the bubble deflates, the macro backdrop could prove more severe than in 2000, because technology’s weight on the economy and on the indices is today far greater. To the loss of financial wealth — the “paper money” that evaporates from the markets — would clearly be added a slowdown in the enormous AI investments, with a recession likely. But, again, not everything would fall: the decline in interest rates that would accompany that slowdown would support other segments, starting with real estate. This is a further reason why a portfolio built by sectors, and not flattened onto the index, retains more ways out.


Conclusion

History never repeats itself, but it often rhymes — Mark Twain supposedly said. And indeed we are not claiming that, as the current euphoria deflates, the following twelve months will exactly retrace those that followed March 2000…but perhaps they will follow a similar rhyme. And the rhyme is in fact already visible — extreme index concentration, enthusiasm over a technology, valuations disconnected from revenues.

A single precedent, of course, is not a statistical basis, and one episode does not guarantee that the scenario will repeat. We do not present it as a forecast, but as proof that the “everything falls” assumption is not a law: the choice to select sectors and styles rests on reasons of valuation and genuine diversification, valid regardless of whether the 2000 play-book repeats.

Finally, let us be clear that we are not calling the top of the technology sector, nor the apex of the speculative bubble: we never do market timing. We are only saying that, should this euphoria deflate — in a nearer or more distant future — not everything will necessarily fall. Some sectors will hold up, and in several cases will rise. It is precisely these that genuinely active management, far from the indices, can seek out and identify: not necessarily the same ones that did well in 2000-2001, perhaps others, but only those who do not replicate the index will be able to find them.


1We deliberately measure only the 12-month window from the Nasdaq’s 2000 highs (from 27 March 2000 to 27 March 2001). This is a precise methodological choice: the 11 September 2001 attacks and the Enron scandal (late 2001) are exogenous shocks, independent of the bubble, and fall outside this window. The US recession (which began, according to the NBER, in March 2001) was instead partly an effect of that same deflation: we keep it outside the twelve months not because it is unrelated, but to isolate the sector rotation before its broader macro effects propagated.
 

This is a marketing communication intended exclusively for institutional investors. Please refer to the Funds’ Prospectuses and the KIDs before making any investment decision.


Like our Niche Insights? Read more here

Follow us on LinkedIn


Niche Asset Management Limited
Authorized and Regulated by the Financial Conduct Authority
17 Lennox Garden London SW1X 0DB – Registered in England – No. 10805355


Back Read More

03
Jun
2026
The ugly duckling of Asia
Posted On June 3, 2026  By admin  And has No Comment

The case for staying in Indonesia when everyone else is heading for the exit

The time of maximum pessimism is the best time to buy, and we believe that for Indonesia that time is now. We may well be the last bulls on Indonesia but we are comfortable with that: it’s always a lonely place just before a possible re-rating.

While the performance in euro terms of our NicheJungle Indonesian Infrastructure Small Caps fund, characterized by a deep value approach, would indicate more boredom than tragedy (as it is almost unchanged since its launch in November 2023), the performance of MSCI Indonesia, also in euros over the same period, delivers an alarming picture: -42%!

The macro backdrop: risks may be plenty, but already in the price

Indonesia offers a compelling long-term growth profile underpinned by demographic strength, a young and expanding consumer base, infrastructure development and abundant natural resources. On key social and financial metrics — per capita wealth trends, household balance sheet soundness, and social equity indicators — Indonesia compares very favourably to regional peers, including India, against which it continues to trade at a ludicrous discount that we consider deeply unjustified.

The fiscal position has deteriorated under President Prabowo. The 2025 deficit reached 2.9% of GDP and is close to the country Constitutional cap of 3%. However, this is below most emerging and developed countries (India 4.3%) and needs to be analysed together with the public debt that stands at a healthy 41% of GDP (India 56%), strong foreign exchange reserves and a solid trade surplus. The rupiah has depreciated approximately 11% against the dollar since Prabowo took office, touching record lows, and Bank Indonesia has been forced to raise rates to defend the currency rather than support growth.

The external environment adds a further layer of complexity. The war in Iran has pushed global oil prices sharply higher, and this matters for a country which is a net importer of crude oil, inflating Indonesia’s fuel subsidy bill. That said, we remind investors that also the coal price has surged and Indonesia exports much more coal in USD terms than imports oil. Hence, the trade surplus won’t be meaningfully affected.

Clearly the Iran conflict has implications beyond Indonesia’s borders that matter for the investment case. With oil prices elevated and inflation risks re-emerging globally, the Federal Reserve’s rate path has shifted materially. Markets that were pricing cuts over the next twelve to twenty-four months are now pricing the opposite — the probability of further hikes has risen, and the recent period of easy dollar liquidity that supports capital flows into emerging markets looks suddenly distant. For Indonesia, this has meant pressure on the rupiah, constrained room for Bank Indonesia to ease, and a higher cost of capital for the sovereign and corporate borrowers alike. These are genuine headwinds. That said, we should remember that wars end, sooner or later, and headwinds can turn into tailwinds.

And here is the critical point: these risks are not hidden. They are on every front page of every media outlet. And have already led to massive capital outflows by foreign investors, taking valuations to unprecedented levels.

Funnily, the dollar-denominated Indonesian equity index trades today about 40% below both its pre-Asian-crisis 1997 level and its pre-Great Financial Crisis 2008 level — while the economy in dollar terms is respectively 6x times larger and 3x times larger. True, GDP and equity indices measure different things, and one should not expect them to move in perfect lockstep. GDP captures the entire economy — listed and unlisted companies, profits and wages alike — while an equity index reflects only the market’s assessment of the future earnings of listed companies. Yet, the logic is simple: if an economy grows by 6 times, it is very difficult to argue that aggregate corporate profits have remained unchanged. A market trading 40% below where it stood three decades ago is pricing permanent profit impairment – and we find that conclusion very difficult to justify.

The contrast with India makes the point even more starkly. See the chart below: between 1996 and 2025, India’s nominal GDP grew from approximately $393 billion to nearly $3.9 trillion — a 10x increase. Over the same period, the MSCI India rose by the same amount, i.e. about 10x. In other words, India’s equity market tracked almost perfectly the growth rate of the underlying economy. This is clearly not a story about risk premia across all Emerging Markets. It is a story about sentiment that in Indonesia has become entirely detached from economic reality.

We are aware that markets can, as Keynes reminded us, remain irrational longer than investors can remain solvent, yet at current prices Indonesian assets are discounting something close to catastrophe. The burden of proof against Indonesia lies entirely with the bears.

Prabowo Subianto

Much of the negative narrative around Indonesia centres on concerns about democratic backsliding and economic mismanagement under Prabowo. These concerns deserve a serious response — and a sense of proportion.

Prabowo’s policy instincts are interventionist and statist. His free school meals programme and network of 80,000 village cooperatives is socially and morally laudable but are expensive, and for the market the fiscal arithmetic is uncomfortable. However, as mentioned, the country is financially sound and can well afford it. Furthermore, creating cooperatives that reduce the cost of living for villagers has a medium-term positive impact on inflation.

His political style — building a coalition that now controls 91% of parliamentary seats and his expanded role for the military in public life — raises legitimate questions about the trajectory of Indonesian institutions. However, only a government with strong majority can successfully promote much needed structural reforms.

The Prabowo perceived risk resembles very much the Modi risk in 2014: a leader who perhaps spends too much and centralises too much. That is a meaningful risk in any emerging market, but it is the very medicine that led to the Indian economic and stock market miracle.

Investing in Indonesia is not comparable to investing in an autocratic state with no rule of law, no independent judiciary, no free press, and no mechanism whatsoever for political accountability. And yet many of the same institutional investors who have cheerfully maintained allocations to Saudi Arabia and China — accepting all those risks as a normal part of the emerging market beta — are now retreating from Indonesia on the grounds of governance concerns. This is not rigorous risk analysis. It is momentum bias masqueraded as discipline.

Indonesia holds regular elections. It has a functioning, if imperfect, judiciary. It has a civil society that took to the streets last year in mass protests and was not met with tanks. The central bank is independent and subject to much less government pressure than the FED…

Prabowo refused to declare martial law during last year’s unrest, relying instead on civilian law enforcement. These are not the hallmarks of a regime in the mould of Suharto, let alone Riyadh or Beijing.

The chart above shows the relationship between a country’s governance standards (as reflected by the World Bank’s scores) and its equity market valuation — better governed markets trade at higher multiples, as one would expect. On this metric, Indonesia scores much better than China, Vietnam and Saudi Arabia or in line with the likes of India and Thailand, and yet, it trades on a large discount vs these markets. In fact, relative to what could arguably be its fair value based on the relationship between governance and valuation, Indonesia is one of the most undervalued markets among EMs — with a gap vs the trendline larger than any other country analysed (except the Philippines).


The export control announcement

A recent development — Prabowo’s May 20th announcement that all exports of palm oil, coal, and ferroalloys must be channelled through a newly created state-owned enterprise — has rattled investors.

The measure is interventionist, and implementation risks are real. The history of Indonesian state-owned enterprises is mixed: some have demonstrated genuine operational capacity; others have become vehicles for patronage and inefficiency. A poorly managed export agency could create bureaucratic bottlenecks, suppress supply, and drive foreign buyers toward competing suppliers.

The deeper policy logic, however, is rational. Prabowo has justified the measure by citing endemic under-invoicing in commodity exports — a practice he estimates cost Indonesia $900 billion between 1991 and 2024. Under-invoicing of commodity exports is not a conspiracy theory: it is a well-documented phenomenon across emerging markets, allowing exporters to understate revenues, minimise tax liabilities, and — critically — retain hard currency offshore rather than repatriating it.

Again, we should remind investors that central dirigisme has been often pivotal to the creation of a strong economy. The Zaibatsu in Japan and the Chaebol in South Korea, for example, have been promoted by dirigiste governments to concentrate investments and develop the economy. Many other countries owe their economic might to centralized economic policies, including in Europe.


MSCI

MSCI’s warning, issued in January 2026, that Indonesia could be reclassified from Emerging Market to Frontier Market status triggered one of the sharpest single-day equity sell-offs in the country’s history.

The concern centred on persistently low free-float levels, potential coordinated trading behaviour, and insufficient transparency around shareholding structures.

This led institutionally constrained funds, whose prospectus rules preclude holding Frontier Market securities, as well as momentum driven investors, to start liquidating part of their positions.

Our view, then and now, is that the MSCI intervention is a welcome catalyst — a necessary escalation to unlock governance reforms that had stalled for too long — and that the probability of an actual downgrade remains low.

The Indonesian regulatory response was unusually swift and concrete: minimum free-float requirements have been doubled to 15% and disclosure requirements for stakes above 5% have been tightened. The incentive to act, given the consequences of a downgrade, was overwhelming.

Unlike the two most recent precedents for MSCI Emerging-to-Frontier downgrades — Argentina in 2009, where the issue was government-imposed capital controls that are structurally very hard to reverse, and Pakistan in 2021, where the market simply lacked sufficient size and liquidity — Indonesia’s problem is one of corporate governance and disclosure.

Concentrated ownership, low free float, opaque shareholding structures. These are fixable problems, addressable through administrative and regulatory action rather than macroeconomic overhaul.

Of course, a downgrade would trigger forced selling from passive vehicles. However, the fundamentals of the underlying businesses would not have changed. Only the index classification would have.

To add insult to injury, MSCI has recently communicated that the weight of Indonesia in the MSCI Emerging Markets Index will be almost halved as from June 2026 to a tiny 0.6% (with instead China + Taiwan + Hong Kong accounting together for more than 50% and India 12%), with this leading to USD1.8bn of outflows.


Valuations: the market is pricing in catastrophe

We have already showed Indonesia’s valuation anomaly vs its EM peers. However, those numbers don’t tell the whole truth. In Indonesia, as was the case in India 10 years ago, there is a huge valuation gap between big caps and small-mid caps, the latter trading at much more depressed multiples: here below the valuations of the 20 holdings in our Indonesian portfolios, companies that are extremely solid and with a bright outlook (financial companies do not have EBITDA multiples). The whole portfolio trades at a P/E below 7x.

This is not a portfolio pricing moderate risk. This is a portfolio pricing near-terminal distress — in businesses that are not in distress.

To be clear about the investment horizon of our Indonesian thesis: we are not calling an imminent catalyst or a near-term re-rating. We never anticipate this. What we are arguing is that at current prices, the risk-reward over a three-to-five-year horizon is asymmetric to a degree that we find very impossible to ignore.

It must also be noted that Indonesia — with its domestically driven economy, negligible technology hardware exposure, and significant commodity and consumer orientation —
offers genuine diversification and a structural hedge against the concentration risk that now dominates conventional EM exposure.


Conclusion

“The stock market is the only market where things go on sale and all the customers run out of the store” – famously said Warren Buffett.

Indonesia is indeed on fire sale — and investors have already run for the exit. With an equity market below its 1996 level against an economy six times larger with very robust fundamentals; an unjustified discount to peers with equal or greater political risk; a Prabowo presidency that warrants scrutiny but not flight; risks overly discounted in equity prices; and the option of real portfolio diversification away from the crowded global technology and momentum trades – with all this, we are happy to stay in the store and pick up quality assets at a heavy discount.


This is a marketing communication intended exclusively for institutional investors. Please refer to Fund Prospectuses and KIDs before making any investment decision.

Like our Niche Insights? Read more here

Follow us on LinkedIn


Niche Asset Management Limited
Authorized and Regulated by the Financial Conduct Authority
17 Lennox Garden London SW1X 0DB – Registered in England – No. 10805355


Back Read More

19
May
2026
Do Emerging Markets still provide diversification?
Posted On May 19, 2026  By admin  And has No Comment

The region does, but the indices don’t

For decades, investors have turned to emerging markets for exposure to alternative economies, sectors or themes — commodities, demographics, the rise of the middle class, etc. — or for exposure to valuations that stood apart from elevated multiples in developed world stocks. That proposition has quietly eroded.

As recently highlighted by this FT article, just three chipmakers — TSMC, Samsung and SK Hynix — now account for almost 25% of the MSCI Emerging Markets Index. The entire IT sector has grown from under 15% of the benchmark a decade ago to its current 37%, leaving the index’s fate closely tied to the same factor that drives US equity markets: artificial intelligence enthusiasm.


The problem is not only sectoral.

The index is equally concentrated geographically: just 3 countries – Taiwan, China and India – account for over 60% of the MSCI EM. This matters for two distinct reasons. China (including its Hong Kong-listed constituents) and Taiwan carry high geopolitical risks that are difficult to price. India, meanwhile, trades at valuations that have long since departed from the emerging market discount that once justified the region’s inclusion in global portfolios.

For an investor holding a global equity portfolio alongside a standard, passive, emerging market fund, the diversification benefit has become largely illusory. What was once a distinct asset class has become, in practice, a combination of two concentrated bets: a high-beta play on the US AI trade, and an unhedgeable exposure to the geopolitical fault line running between China and the West.

The role of passive investing

Understanding why EM indices have converged with US equity markets requires recognising the role, among other factors, of passive capital flows. ETFs are clearly composed of the largest and most liquid constituents. As those stocks rise, their index weights increase, attracting further passive inflows — a self-reinforcing dynamic that has steadily reshaped the composition of all benchmarks, including emerging market indices.

This mechanism does not allocate capital according to value, diversification or fundamentals. It rewards size, liquidity and, above all, momentum. The consequence is emerging market indices that now reflect the same momentum-driven concentration visible in the S&P 500, rather than the diverse exposure to local economies, commodities, infrastructure, demographics and domestic consumption that once justified the region’s role in a balanced portfolio.

The “real” emerging market economy — the Indonesian agricultural company trading at a huge discount to the value of its estate, the Korean domestic retailer ignored by foreign investors, or the Philippine telecom with a high-growth and lucrative payment business — is largely absent from these indices and therefore absent from the capital allocated to them. And it is in precisely these neglected segments that genuine diversification, and the potential for long-term value realisation, are most likely to be found.


The dot-com precedent

The current configuration of global equity indices is not without historical precedent. At the peak of the dot-com bubble in March 2000, Information Technology represented approximately 32% of the MSCI World Index. The narrative driving that concentration seemed similarly compelling: the internet was transforming every aspect of the economy, productivity gains were structural, and the technology companies leading this revolution deserved premium valuations.

Over the subsequent decade, the IT sector’s weight in the MSCI World fell from 32% to roughly 12% by 2010 — not because technology ceased to matter, of course, but because valuations had run far ahead of earnings. The reversion was painful and prolonged. Investors who had concentrated in the sector via the index endured a decade of underperformance against sectors that had been neglected during the boom years — energy, materials, financials. Exactly the same value-oriented exposures that benchmarks are, again, ignoring today.

Today, IT accounts for approximately 28% of the MSCI World, more than double its weight in 2010 on the back of the AI cycle. The fundamental quality of today’s technology leaders appears to be significantly higher than in 2000 and the AI cycle may have further to run, but the question of concentration risk is structurally separate from the question of whether technology is a good business.

We are not making a market or sector timing call. We are just arguing that a portfolio that is exposed to the same factors — technology, semiconductors, AI — across its domestic equity, global equity, and emerging market equity allocation, has far less diversification than it appears to have. And more often than not, the discovery of this portfolio feature tends to happen at the worst possible moment.


The “real emerging markets” that are missing in the indices

Emerging markets host thousands of listed companies across a broad spectrum of sectors, sizes and uncorrelated drivers. The vast majority never appear in benchmark indices. They are too small for large ETFs, poorly covered by sell-side analysts, and outside the narratives that attract institutional capital.

What makes these overlooked segments genuinely different is not just their geography, but the economic forces that drive them. They do not move because Nvidia’s Jensen Huang raises guidance or boards a last-minute flight to China.

Over the last 20 years both the MSCI EM and the MSCI Asia Pacific have showed a correlation with the S&500 of more than 0.75 – a reminder that geographic labelling is not the same as economic diversification.

Passive or “closet passive” EM funds that closely track the indices while charging active fees give investors the label of diversification without the substance. True portfolio diversification requires exposures that are structurally, not just geographically, different from the rest of the portfolio.

History has also shown a persistent feature of traditional emerging market indices – their correlation with the S& 500 tends to rise during periods of global market stress, precisely when diversification is most needed, reflecting two main compounding factors: a generalised rise in risk-off sentiment that hits emerging markets disproportionately hard; and importantly a technical liquidity dynamic, whereby investors tend to sell first and fastest the most liquid names in leading indices, regardless of fundamentals.

Portfolios built around companies with limited index overlap would have a structurally weaker link to these periods of global market stress: risk-off episodes remain unavoidable, and no portfolio would be immune — but at least the “liquidity-channel” that hits index constituents first and hardest would largely bypass them.


Conclusion

Emerging markets were added to global portfolios to provide something genuinely different. For most of their history, they delivered on that promise — different industrial sectors, different economic cycles, different valuations. The problem is not that emerging markets have become less interesting. It is that the standard vehicles for accessing the region — i.e.: the EM or Asia Pacific leading indices — have ceased to represent it.

The indices today are mostly a concentrated bet on a small number of Asian semiconductor companies, embedded within a global equity landscape that is itself increasingly concentrated in the same technology theme. Adding a standard EM-index allocation to a global portfolio no longer reduces concentration. In many cases, it increases it.

In an increasingly benchmark-driven world, genuine diversification can no longer be found in the indices themselves, but in the overlooked segments of the market that passive capital structurally ignores. As capital becomes more concentrated, diversification itself has become a niche asset.


Like our Niche Insights? Read more here

Follow us on LinkedIn


Niche Asset Management Limited
Authorized and Regulated by the Financial Conduct Authority
17 Lennox Garden London SW1X 0DB – Registered in England – No. 10805355


Back Read More

30
Jan
2026
MSCI’s Indonesia Warning: A Welcome Catalyst for Change
Posted On January 30, 2026  By admin  And has 2 Comments

Market dislocation driven by index mechanics rather than fundamentals


MSCI as a catalyst — and, ultimately, a benefactor

MSCI stated this week that it sees “fundamental investability issues” in the Indonesian equity market, citing persistently low free-float levels, potential co-ordinated trading behaviour and insufficient transparency around shareholding structures. This was accompanied by an explicit warning that Indonesia could be reclassified from Emerging Market to Frontier Market if these issues are not addressed by May 2026.

While the knee-jerk market reaction was negative — with Indonesian equities experiencing one of the sharpest sell-offs in recent history — from our perspective as value-driven, long-term investors with a meaningful and long-dated exposure to Indonesia, this episode represents a welcome and long-overdue catalyst for change.

For years, we have highlighted how limited free float in large-cap Indonesian companies included in the MSCI indices has distorted price formation, inflated valuations and allowed controlling shareholders to exert disproportionate influence over markets and, arguably, through their political capital and proximity, over the regulatory framework as well. This is why as investors we have mostly avoided the larger cap companies within the MSCI complex while focusing our attention on the better-valued smaller companies outside the indices.

In this context, MSCI’s unusually direct intervention should be seen as a necessary escalation to unlock reforms that had stalled for too long. Increased free float and improved transparency would ultimately be positive for market depth, liquidity and valuation quality. Even if the transition phase proves uncomfortable, the current correction may well represent a constructive reset and a necessary step toward a healthier and more investable Indonesian equity market.

Importantly, this governance-driven reset would come at a time when cyclical fundamentals in Indonesia are also turning more supportive. Our ongoing dialogue with companies on the ground points to strengthening momentum across several sectors – including real estate, banks, construction and consumers – suggesting that the timing of these reforms is particularly favourable. In our view, the alignment between potential, structural-governance improvements, and an improving cyclical backdrop materially strengthens the medium-term investment case for Indonesia.

Of course, some volatility is likely to persist in the near term as the dust takes time to settle. However, as regulators deliver on the measures already announced, we believe new capital will be redirected toward the Indonesian equity market, supporting a long-overdue multi-year re-rating. As seen previously in Japan (following the earthquake and Abe’s assassination) and in Korea (after the attempted state coup), disruptive events often are needed to revive deeply neglected equity markets.

In the case of our Indonesian Small Cap strategy, many holdings — which have exceptionally depressed valuations and a more domestic investor base— have been caught in the headline-driven selling. This has widened the disconnect between price and fundamentals, reinforcing the opportunities in companies with strong balance sheets and solid growth prospects. With both structural and cyclical conditions now aligning more favourably, we are therefore comfortable adding to our Indonesian equity positions.


The Context

Indonesian equities have experienced one of the sharpest sell-offs in recent history this week. The Jakarta Composite Index fell over 10% intraday on Wednesday, triggering trading halts, before reducing losses to 7% at the close. The catalyst was MSCI’s announcement highlighting “fundamental investability issues” related to free-float levels, possible co-ordinated trading behaviour and shareholding data transparency, accompanied by an explicit warning that Indonesia could be reclassified from Emerging Market to Frontier Market if these issues are not resolved by May 2026.

MSCI’s warning follows several months of consultations and discussions with local regulators and market participants on free-float levels and ownership disclosure, suggesting a degree of accumulated frustration with the pace of progress on long-standing investability concerns.

Given Indonesia’s weight in global EM benchmarks, the potential consequences of such a reclassification are material. Many institutional investors and passive vehicles are constrained by prospectus rules that would force an exit in the event of a downgrade. As a result, the initial market reaction was dominated by pre-emptive selling, particularly in index-heavy large-cap stocks.

Yesterday Indonesian equities staged a significant late-afternoon reversal — trimming again early losses of over 10% to close only 1.1% lower — after regulators announced they would double the minimum free-float requirements starting next month and signalled that the sovereign wealth fund Danantara may step into the market to provide stability. Shares rose 1.2 per cent today after the announcement that the Head of the Indonesia Stock Exchange would step down “as a form of accountability over the condition of the Indonesian capital market in the past few days”.

This policy-driven stabilisation suggests that the market may already be responding to improved policy visibility, even as uncertainty around execution remains.


What is at the core of MSCI’s concern

MSCI’s message was unusually direct for a large Emerging Market. The core issue is not market size or macro fundamentals, but opacity in ownership structures and persistently low effective free float in several large index constituents.

In many cases, controlling shareholders retain overwhelming stakes, limiting true tradability and contributing to price distortions.

This is not a new structural feature of the Indonesian market. However, over time it has created a widening gap between headline market capitalisation and actual investable opportunity – a gap MSCI has now explicitly challenged. MSCI has already taken action, as for the February 2026 index review, it has frozen all upgrades and additions for Indonesian stocks. This should be read as a warning shot with a clear deadline: corrective action must be taken by May this year.

From a regional perspective, Indonesia stands out for its structurally low average free float when compared with other major Asian equity markets. Indonesia currently has the lowest minimum free-float requirement among major Asian markets, at 7.5% (to double to 15%by next month – as said earlier), well below regional peers. By comparison, Hong Kong and India both require a minimum free float of 25%, while Thailand already applies a 15% threshold.


Historical Precedents: Why Indonesia’s Situation Is Different

MSCI downgrades from Emerging to Frontier status are rare, but they offer instructive lessons. Two recent cases stand out:

  • Argentina (2009): downgraded due to capital controls and FX restrictions imposed in the wake of the Great Financial Crisis. The issue was policy-driven market accessibility — a problem far harder to reverse than free-
    float requirements and data transparency

  • Pakistan (2021): downgraded due to insufficient market size and liquidity, alongside economic instability. The core constraint was thus a structural limitation (the actual absence of an equity market) that cannot be quickly addressed

Indonesia’s challenge is fundamentally different.

The problem is not capital controls, FX constraints or a lack of market size. Indonesia’s equity market is large, liquid and open. The issue is corporate governance and disclosure – specifically, concentrated ownership, inadequate free-float and shareholder transparency.

Crucially, this is a fixable problem. Raising free-float requirements and improving ownership disclosure are administrative and regulatory actions that can be implemented relatively quickly, as showed by yesterday’s regulatory response. They do not require overhauling macro policy (as in Argentina) or waiting for a market to grow organically (as in Pakistan). This distinction matters. It means that MSCI’s pressure should not be interpreted as a final, non-appealable verdict on Indonesia’s investability, but as a catalyst for targeted and achievable reform — one that aligns the interests of regulators, corporates and long-term investors.


Regulatory Response: unusually swift and concrete

Unlike past episodes of market stress, the regulatory response this time has been rapid, detailed and operational. Within hours, Jakarta’s Stock Exchange and Indonesia’s Financial Services Authority publicly committed to addressing MSCI’s concerns and announced a concrete set of measures, including:

  • Raising minimum free-float requirements to 15% for both existing listed companies and future IPOs

  • Immediate focus on improving disclosure for shareholdings above 5%

  • Release of ultimate beneficial ownership data for around 100 companies, to be shared directly with MSCI.

The stated target is to resolve key issues by March 2026, well ahead of MSCI’s May review. Given the damage to the country from a potential downgrade the incentive to act was and still is overwhelming.


Implications for investors and Portfolio positioning

MSCI’s unusually direct intervention should be seen as a necessary escalation to unlock reforms that had stalled for too long. Increased free float and improved transparency would ultimately be positive for market depth, liquidity and valuation quality. Even if the transition phase proves uncomfortable, the current correction may well represent a constructive reset and a necessary step toward a healthier and more investable Indonesian equity market.

Importantly, this governance-driven reset would come at a time when cyclical fundamentals in Indonesia are also turning more supportive. Our ongoing dialogue with companies on the ground points to strengthening momentum across several sectors – including real estate, banks, construction and consumers – suggesting that the timing of these reforms is particularly favourable. In our view, the alignment between potential, structural-governance improvements, and an improving cyclical backdrop materially strengthens the medium-term investment case for Indonesia.

Of course, some volatility is likely to persist in the near term as the dust takes time to settle. However, as regulators deliver on the measures already announced, we believe new capital will be redirected toward the Indonesian equity market, supporting a long-overdue multi-year re-rating. As seen previously in Japan (following the earthquake and Abe’s assassination) and in Korea (after the attempted state coup), disruptive events often are needed to revive deeply neglected equity markets.

In the case of our Indonesian Small Cap strategy, many holdings — which have exceptionally depressed valuations and a more domestic investor base— have been caught in the headline-driven selling. This has widened the disconnect between price and fundamentals, reinforcing the opportunities in companies with strong balance sheets and solid growth prospects. With both structural and cyclical conditions now aligning more favourably, we are therefore comfortable adding to our Indonesian equity positions.


Like our Niche Insights? Read more here

Follow us LinkedIn

This is a marketing communication intended exclusively for institutional investors.

Please refer to the fund prospectus and KIDs before making any investment decision.


Niche Asset Management Limited
Authorized and Regulated by the Financial Conduct Authority
17 Lennox Garden London SW1X 0DB – Registered in England – No. 10805355


Back Read More
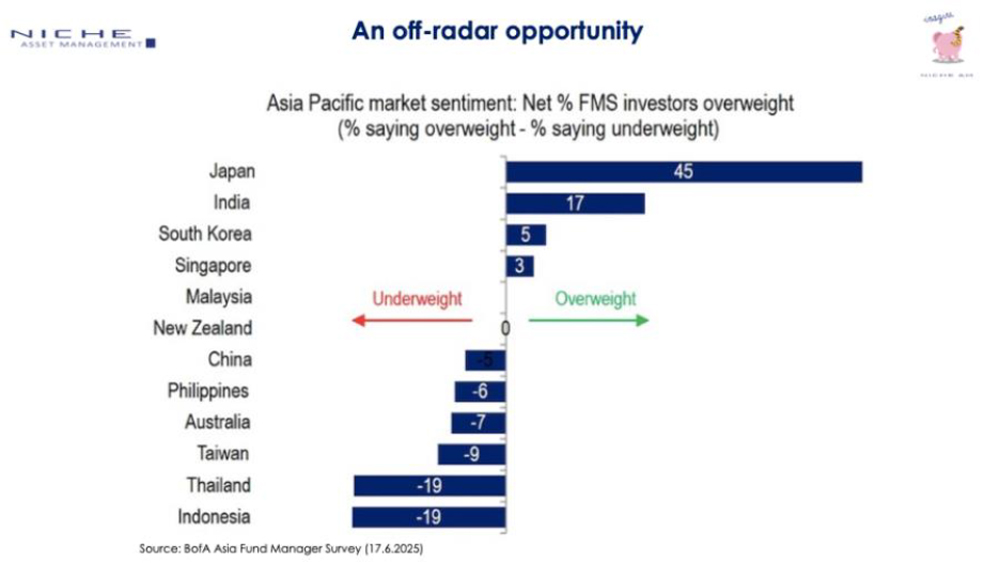
08
Oct
2025
EVs are dead, long live EVs
Posted On October 8, 2025  By admin  And has 4 Comments

The obituaries of the electric car are very reminiscent of the resistance against automobiles.

It is said that in 1903 Henry Ford gave the opportunity to buy shares in the newly formed Ford Motor Company to a certain Horace Rackham, the lawyer who had drawn up the articles of incorporation of the newborn company. Rackham asked the Michigan Savings Bank for a loan, but its President refused, warning him with a phrase that has gone down in history: “The horse is here to stay, but the automobile is only a novelty — a fad”.

Fortunately for him, literally, Rackham ignored the advice. He got into debt with another banker and bought 50 shares out of a total of 890. Over time, thanks to his investment, Rackham became very rich, and his story became a symbol of short-sightedness towards innovation.

In recent years, the narrative of the “death of electric cars” has become fashionable. According to this narrative, prices still considered too high, infrastructures considered insufficient, autonomy judged inadequate, and a plethora of other factors have allegedly decreed the failure of the technology. But the history of the automobile, and of technologies in general, shows that industrial transitions are never linear and that obituaries written too early often end up looking ridiculous.


The Historical Precedent: From Horses to Automobiles

Just as with today’s electric car, the internal combustion automobile also began — in the late nineteenth and early twentieth centuries — as a phenomenon confined to the elite.

And this was despite its obvious advantages, clear to everyone from the very start.

Already at its debut, the first Benz reached about 16 km/h, faster than the average speed of a horse (10–15 km/h).

Its range per full tank was around 45 km, but — as Bertha Benz, Karl’s wife, demonstrated in 1888 — with refuelling stops along the way it was possible to cover more than 100 km in a single day, compared to the roughly 35 km a horse could manage.

Meanwhile, the structural limits of horse transport were becoming increasingly unsustainable. By the end of the nineteenth century, London hosted about 200,000 horses which, producing and dumping a total of 2,000 tons of manure per day, triggered the so-called “Great Horse Manure Crisis”. Streets were flooded with dung and urine that attracted flies and spread diseases such as typhoid fever.

In addition to the prohibitive cost of early automobiles, the new technology faced cultural resistance (the power of tradition) and psychological resistance (fear of the unknown).

But — then as now — it was above all the economic interests of the status quo that slowed adoption. Chief among these were the lobbies tied to the horse economy: an entire supply chain of breeders, blacksmiths, harness and feed manufacturers, and municipal horse-drawn transport services such as urban trams, all of whom viewed the car as an existential threat.

This resistance from the economic establishment naturally took on political and regulatory form. In Britain, the Red Flag Act of 1865 — originally intended for steam vehicles — required every road locomotive to be preceded by a man on foot waving a red flag, and imposed absurdly low speed limits. Remaining in force until 1896, it effectively prevented the spread of the first automobiles. In Italy and other European countries, subsequent regulations were equally strict, curbing automobile circulation well into the years leading up to the First World War.


The turning point: Henry Ford

The assembly line introduced by Henry Ford in the early 1900s drastically reduced unit costs, making the automobile affordable for the middle class.

The widespread adoption of the Ford Model T was also supported by the abundance of oil made available in those same years through the exploitation of major new U.S. oil fields by John D. Rockefeller’s Standard Oil, which ensured large-scale, low-cost fuel supply.

With lower production and operating costs, the cost per kilometre of cars fell below that of horse-drawn transport — explaining the rapid switch-off of animal traction. The Model T marked the definitive victory over the horse and the carriages it pulled, which were gradually relegated to museums.


World War I

World War I accelerated everything.

The loss of millions of horses during the war was an indirect but significant factor in the replacement of animal traction with the automobile.

Wartime needs — for trucks, ambulances, and military vehicles — led to large-scale production, standardization, and improved reliability.

Thousands of soldiers and mechanics learned to drive and perform maintenance; upon returning home, they became the first civilian drivers and mechanics. In 1913, around 7,000 automobiles were in circulation in Italy; by 1927, the number had already exceeded 100,000.


The Advantages of Electric Cars Are Already Evident Today

As in the past, the advantages of the new technology are already clear and undeniable.

Compared to combustion vehicles, electric cars:

  •  are silent;
  •  are vibration-free;
  • offer superior performance (instant acceleration, smoother drivability, no gear shifting);
  •  have lower maintenance costs;
  • and have a far less negative impact on the climate, health, and the environment.

Despite the denialist positions prevalent in Trumpism in the United States and elsewhere, science has now extensively demonstrated the link between fossil-fuel emissions, greenhouse gas concentrations, and climate change.

The Intergovernmental Panel on Climate Change (IPCC) has concluded that human-induced CO₂ emissions — largely from transport and energy production — are the main cause of global warming observed since the mid-20th century. The International Energy Agency and the United Nations have stressed that reducing the stock of combustion-engine vehicles is a necessary condition to meet the Paris Agreement goals.

But even leaving aside this scientific certainty, another equally urgent one remains: the direct impact of smog and noise from combustion vehicles on human health. Traffic-related smog has been classified by the WHO as a proven carcinogen, with documented effects on lung cancer and cardiovascular diseases. The European Environment Agency estimates that air pollution causes over 300,000 premature deaths every year in Europe. Noise pollution from traffic is not a minor issue either: urban noise is the second leading environmental cause of disease after air pollution, linked to stress, sleep disorders, and heart disease.

And oil doesn’t pollute only when used: transporting it means accidents, spills, and chronic marine contamination. In 2023 alone, over 2,000 tons of crude oil spilled into the sea due to tanker accidents.

At the beginning of the 20th century, people used to claim that horses spread infectious diseases, while cars had no negative health effects — which wasn’t entirely true: cars simply had fewer negative effects. In the same way, electric vehicles have often been sold as entirely harmless for the environment and health. They do have an impact, but one that is vastly smaller than that of internal combustion vehicles. The use of renewable energy in lithium cell production and the improvement of battery recycling processes should further reduce this impact in the years to come.


Common Objections to Electric Cars

Critics focus on several limitations — some real but easily solvable, and others simply unfounded:


    • Charging and Range. Charging stations across Europe are expanding rapidly, and unlike the internal combustion engine — which has already reached near-maximum refinement — battery chemistry is still evolving at a fast pace. It is now realistic to expect that in the near future vehicles will achieve ranges of around 1,000 km, with much faster charging times. BYD’s recent announcement of a battery capable of adding 470 km of range in just five minutes marked a true paradigm shift. Moreover, solutions such as wireless charging offer a scalable path even for the historic centers of European cities. It’s worth remembering that the potential for improvement in battery chemistry remains vast, whereas internal combustion engines have far less room left to improve in terms of efficiency and performance.


    • Energy-intensive production. It is true that battery manufacturing today consumes a large amount of energy, but this limitation will shrink dramatically as renewable energy use expands. In the meantime, the simple fact of eliminating exhaust emissions in cities already translates into fewer cancers and respiratory diseases.


    • Recycling. At present, only a small share of materials from lithium-ion batteries is recycled. However, the EU has set binding targets for the recovery of key materials — in some cases up to 85% — by 2036, effectively creating a new industrial sector.


    • Costs. Battery prices continue to decline: in 2013 they exceeded $700/kWh; by 2023 they had already fallen to $139, and in 2024 reached $115/kWh. According to BloombergNEF, they are expected to drop below $100/kWh within a few years. Falling battery costs make electric cars increasingly competitive, especially in urban segments. The price gap with equivalent ICE models has narrowed rapidly, and in some cases — thanks to public incentives — EVs are already cheaper to purchase. The real bottleneck remains the cost of public charging, often inflated by utilities. Public intervention, such as government-imposed price caps, would make electric mobility immediately more competitive. It is therefore a political obstacle, not a technological one.


  • Social impact. What will happen to workers in the internal combustion sector? The automotive supply chain employs around 13 million people in Europe, roughly 7% of total employment. The answer is not to halt the transition, nor to rely solely on sterile protectionism against Chinese EVs, but to retrain the workforce toward battery production, electrical components, and EV infrastructure. This approach builds manufacturing capacity and creates high-quality jobs in Europe — while protecting the local industry from Beijing’s otherwise unbeatable competition.


The Forces Slowing the Transition

As in the early days of the automobile, today’s resistance does not stem from technical flaws in the new technology, but from the influence of powerful economic lobbies — those of the horse industry back then, and today those of fossil fuels, internal combustion components, and electric utilities.

In the United States, Trumpism — fueled by funding from the oil and gas sector — has made the war against electric vehicles one of its main political battle horses. The oil and gas industry has led the opposition to Joe Biden’s pro-EV policies and generously financed Republican campaigns in the 2024 elections.

The intervention of the fossil fuel lobbies, however, only delays the inevitable: the internal combustion sector — like the horse economy before it — is destined for extinction. Defending the interests of a dying industry instead of protecting and building productive capacity in the sectors set to dominate 21st-century manufacturing is a major strategic mistake.

Batteries, electric motors, and power electronics are fundamental building blocks not only for electric vehicles, but also for a wide range of emerging sectors such as drones and robotics — technologies that are essential to advanced defense systems and therefore to national and regional security, as demonstrated by the ongoing conflict in Ukraine.

Increasingly, lithium batteries will also supply the energy that powers the data centers at the core of today’s AI revolution.

The industrial implications are enormous: the supply chain needed to manufacture a smartphone or a robot is no longer very different from the one required to produce an electric car or a military drone. It is no coincidence that Xiaomi — originally a smartphone manufacturer — has rapidly become one of China’s largest EV producers. And BYD, thanks to its vertical integration in electric technologies, is now among the most powerful manufacturing companies on the planet.

For Europe, this means that subsidizing battery production, reallocating workers and capital to the new electric stack, and developing local supply chains is not only an ecological and industrial choice: like steel or semiconductors in the past, batteries today are also a geopolitical and defense necessity. If the Chinese and Koreans are too far ahead, Europe must encourage joint ventures with knowledge-sharing agreements — just as China once required from European manufacturers operating there.


An Investment Opportunity

Today, as in the past, change — and the resistance to it — creates enormous opportunities.

Right now, excessive pessimism surrounds electric mobility among investors and in the financial press, fueled by the political propaganda of fossil lobbies. As a result, stocks linked to the lithium battery ecosystem trade at extremely depressed and attractive valuations, especially outside China. Despite the dominance of momentum investing today, it is precisely when “everyone is against it” that the best investment opportunities arise.

This is exactly what we are seeing in markets such as Korea and Japan, where low multiples reflect negative narratives rather than industrial fundamentals. It is worth remembering that only Korea and Japan — two democratic nations — currently possess technologies that can truly compete with those of China, an autocratic country that cannot be considered fully reliable.

A century ago, it was war, Fordism, and abundant oil that imposed the internal combustion car; today, it will be consumers, climate and health regulations, geopolitical and security imperatives, and global competition — primarily from China and the United States — that drive the adoption of electric vehicles.

The lesson from history is clear: industrial transitions are slow and contested, but once underway, they become irreversible. Horse-drawn carriages ended up in museums — and in a few years, the same fate will await combustion engines. Because two technologies cannot coexist for long when one is clearly superior to the other.And because, in the end, history never repeats itself exactly — but it often rhymes. EVs are dead, long live the EVs.

How to Invest in Electric Mobility

Niche AM investment team has been a pioneer in the field: in 2015, it launched the world’s first thematic fund dedicated to electric mobility, managing it successfully until early 2018. In 2019, the team launched its follow-up with Niche AM — the Safe Capital Electric Mobility Value fund — once again focused on the lithium battery universe and managed with a deep value approach aimed at limiting volatility and downside risk. Click on the image below for more details about our fund.


Follow us LinkedIn

This is a marketing communication intended exclusively for institutional investors.

Please refer to the fund prospectus and KIDs before making any investment decision.


Niche Asset Management Limited
Authorized and Regulated by the Financial Conduct Authority
17 Lennox Garden London SW1X 0DB – Registered in England – No. 10805355


Back Read More
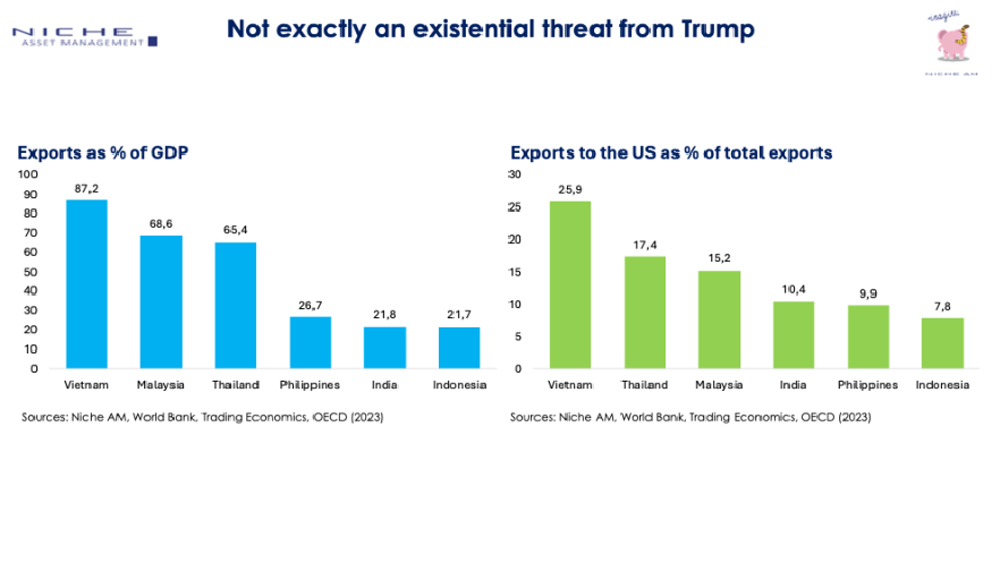
20
Jun
2025
Aspice, Respice, Prospice
Posted On June 20, 2025  By admin  And has 2 Comments

Bank of America’s new Fund Manager Survey (FMS), released this week, confirms an old saying — attributed to a local entrepreneur — that “Indonesia is the largest invisible object in the world.”.

It’s hard to disagree.

Among the top 15 countries in the world by extension (larger than the whole of Western Europe), 4th by population (moreover very young), among the top 16 countries in the world by nominal GDP, very rich in natural resources, and a strategic geopolitical position between the West and China, Indonesia remains one of the great forgotten markets: according to BofA’s FMS — which collects the opinions of about 200 fund managers with total assets under management of more than $500 billion — Indonesia is the least loved country in Asia-Pacific.

For any investor, such an extreme view should merit further analysis. Niche AM provides institutional investor with exposure to a portfolio of 150 Indonesian stocks that trades below 7x earnings and at 35% discount on tangible equity – valuations that already discount very adverse scenarios. Scenarios that, as seasoned investors in the area, we struggle to identify.

The negative perception of the area also reverberates on its currency, although the rupiah has extremely solid fundamentals.

The risk of tariffs linked to Trump plays a role, but we believe it is exasperated: Indonesian exports to the United States are worth just $26 billion – less than 8% of the country’s total exports and less than 2% of GDP, the lowest exposure among peers in Asia Pacific (in fact, among these, Indonesia is the least dependent country on exports). The narrative of a systemic threat related to Trump’s trade war does not stand the test of numbers.

The current macro environment could, on the contrary, play in Indonesia’s favor, both on the currency and equity fronts:

  • The flight from Trump’s uncertainty should support credible emerging currencies such as the rupiah;
  • A gradual reallocation of capital, after years of hyper-concentration on US indices, could finally bring attention back to more peripheral markets. In a relatively small market like Indonesia, even a modest global rebalancing could have a significant impact on prices;
  • Indonesia is also expected to benefit from a growing demand for diversification away from China. More and more investors in emerging countries could, in the near future, turn to looking for alternatives, in the area, to a slowing China, to a Taiwan that does not incorporate geopolitical risks and to India’s valuations. In addition, Indonesia could benefit from the diversification of its supply chain, which is now very Sinocentric, becoming a key hub in a number of industries linked to its immense mineral and agricultural resources.
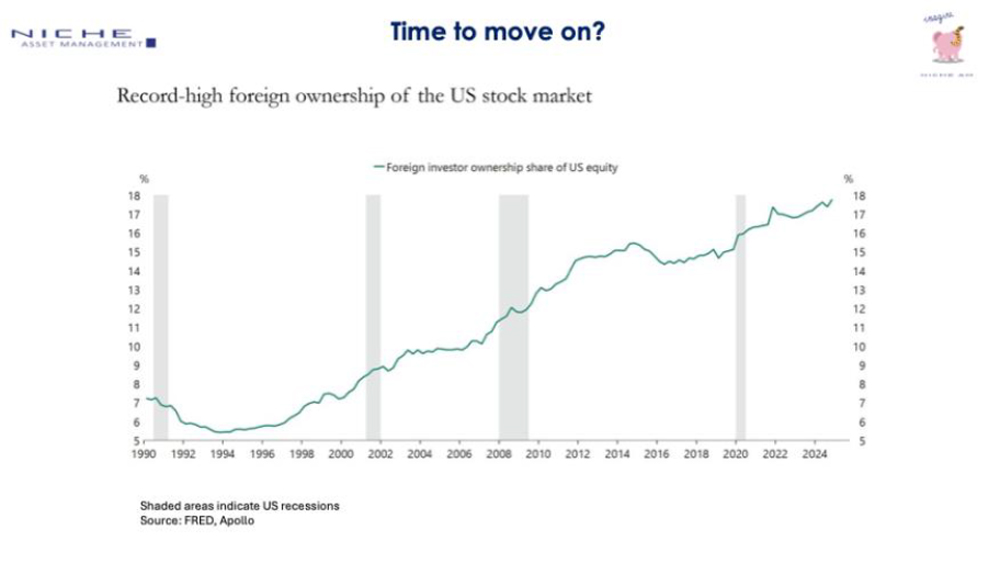
At the domestic level, since his election in October 2024, President Prabowo has progressively reoriented the government agenda away from traditional physical infrastructure towards “soft infrastructure” interventions, such as the school meals program and mass health screenings. These are populist programs, which produce more results in terms of political consensus than on population’s well-being. This is not a welcome outcome for the market, although it was part of his election platform.

However, let’s remember that 55% of the 280 million inhabitants live in Java, which represents just 7% of the country’s surface. Here the density is almost double that of Bangladesh! The rest of the country is rich in resources and blessed with a mild climate. And it lacks ports, airports, roads, homes, schools, hospitals, railways, etc. Structures that will be able to maintain and increase the already strong growth rate of the country. That’s why our fund focuses on infrastructure.

The challenge for Prabowo is the same as that of his predecessor Jokowi: how to finance the construction of the country while respecting the constitutional constraint of 3% deficit/GDP. However, it should be remembered that in Indonesia the public and household debt to GDP ratio is the lowest in the Asia Pacific area, leaving ample room for manoeuvre. In addition, private-public partnerships may be partly the solution.
…as soon as the world realizes the existence of this great country.

We never indicate an entry level. But we are already there. We believe there is a very good chance that Indonesia could become the new India, especially in the small-cap segment, where, as has already happened in India over the last decade, the excessive valuation gap with large-caps could finally be closed. Being a deep value investor does not mean “being right against everyone”, but having the discipline to analyze with detachment the risk/benefit profile of the investment opportunities available, which is often at its best when investor neglect is maximum.

Aspice, respice, prospice.

Click here for more details about our fund.


This is a marketing communication intended exclusively for institutional investors.

Please consult the Fund Prospectuses and KIDs before making any investment decisions.

Follow us on LinkedIn


Back Read More
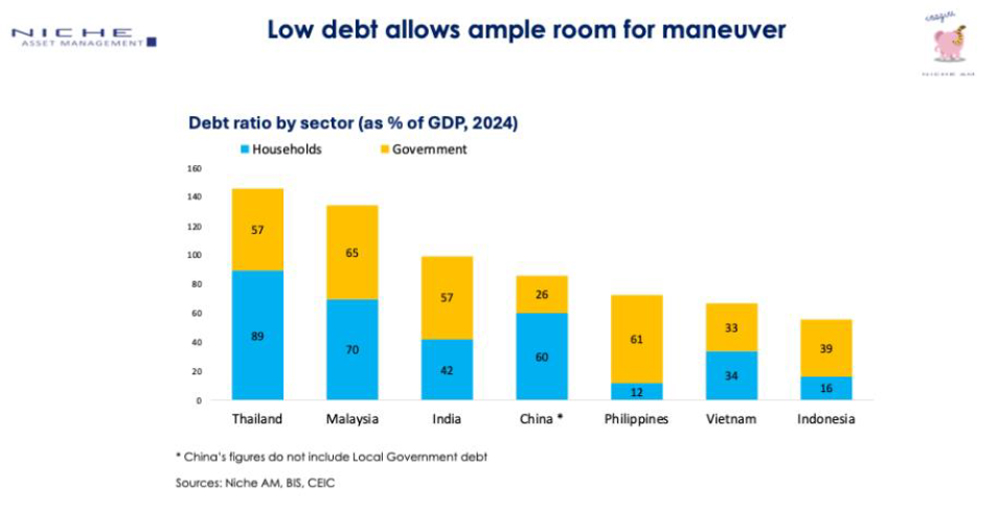
30
May
2025
Niche AM feedback on the call for evidence for the revision of the SFDR
Posted On May 30, 2025  By admin  And has 1 Comment

On 2 May 2025, the European Commission (EC) initiated a Call for Evidence to gather input for its impact assessment for the simplification of the Sustainable Finance Disclosure Regulation (SFDR). This is the final consultation before the Commission presents its proposed reforms, expected in the fourth quarter of 2025.

Niche Asset Management has decided to share its own view on the matter by responding to the EC’s call for evidence. Find below our feedback.

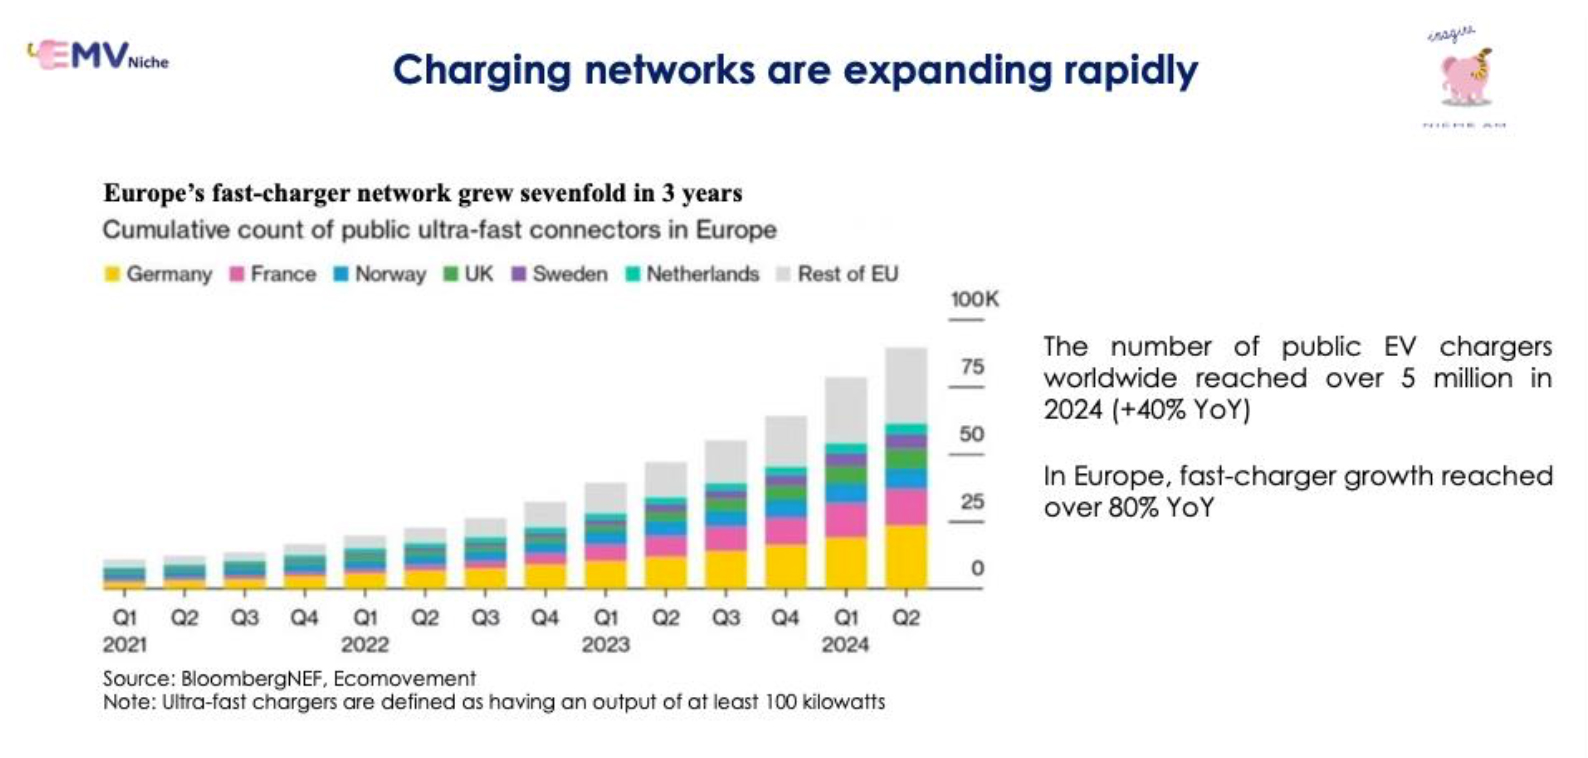
    1. AIM OF THE REGULATION. Sustainability regulation is an essential tool for risk management not for improving the world. This is a side effect. Sustainability regulations should not distort or imperil investments as today it is a case (increases concentration, lifts the risk premium of sectors and geographies that must on the contrary be supported).

    2. LACK OF SCORING FRAMEWORK FOR PROVIDERS. Today’s approach is very focused on exclusions (screening off) and it is functional to passive/low tracking error/momentum investing. This approach has many issues. The main in our opinion is that it depends on scores made by providers that have different approaches. They need guidelines from the regulator to be consistent

    3. BEST IN CLASS. Best in class is by far the best way to assess static sustainability. Other methods that compare different sectors should be abandoned as they are highly distortive and are not just unfair but also harmful. However, the providers must be encouraged to create cluster of companies consistent not just in terms of sectors but also of regulatory requirements.
      EU regulations impose more stringent sustainability requirements, meaning European firms are often compelled by law to meet higher standards. In contrast, a company operating in a less regulated jurisdiction may have limited legal obligations but nonetheless choose to go beyond them in pursuit of sustainability improvements. A best-in-class or relative approach would allow for more meaningful benchmarking by crediting companies that make genuine progress relative to their local regulatory context and sectoral baseline. In this regard, the regulator should encourage data providers to offer more refined and contextualised analysis, creating company clusters that reflect both industry type and the applicable regulatory framework. Without such segmentation, there is a risk that disclosures will favour companies already operating under stricter regimes, thereby discouraging investment in regions and sectors where the need for sustainable transformation is most urgent.

    4.  ARTICLE 9. The sustainable goals underlying the Art. 9 funds are often vague; the implementation is difficult both from an investing and a compliance perspective. We think that the spirit of article 9 should be met by a more active investment approach that involves direct, documented engagement with the investee companies with a clear focus on improvement, driving positive environmental and social real economy outcomes. This approach cannot be applied by a number of actors like ETFs, low TE funds, high turnover funds, momentum funds that will stick to exclusions. However, long term, fundamental, activist investors can do it, helping and encouraging companies across their sustainability path.

    5. PAI STATEMENT. They are now misleading, comparing apples to pears. The disclosure and comparison of PAI indicators of a fund’s portfolio does not consider the changes in the composition of the underlying holdings, which are based on investment opportunities. As a result, a shift in sectoral or geographical allocation can lead to significant variations in reported PAIs—variations that may reflect portfolio turnover rather than actual improvements or deteriorations in sustainability performance. Comparing PAI indicators across different portfolio compositions does not offer meaningful insights. It undermines comparability across time periods and between funds. It would be more logical and informative to calculate and track PAI indicators over time using the same portfolio—ideally the latest one. This approach would make the evolution of sustainability performance clearer and more aligned with the actual investment strategy, helping both asset managers and investors to interpret changes in a more accurate and transparent way. We have been complementing for years the regulatory PAI with this “dynamic” PAI that we have created with great benefit.

    6. DYNAMIC APPROACH. In the regulation great space should be given to the dynamics. Together with dynamic PAI, also the ESG/DNSH data should analysed through their dynamics. The path is extremely important, more than the picture. This can really provide opportunities and speed up companies that are smaller or active in EM and reduce complacency for big companies active in highly regulated environments and/or active in industries that are by definition less polluting.

    7. REGULATION PRODUCTION GOVERNANCE. The regulation governance that produced the previous framework must be changed and more diverse voices, experiences, needs and feedback should be brought to the table. Lobbying from great players of ETFs/Funds (industrial AM) should be balanced with contributions from active, fundamental asset management able to bring real value to sustainability. The new framework should help, not hinder, the active, fundamental AM companies that are vital for the investment ecosystem.

Download the Pdf here

Follow us on LinkedIn

This is a marketing communication intended exclusively for institutional investors.


Back Read More

28
Mar
2025
EV charging speed? Checked! What’s next?
Posted On March 28, 2025  By admin  And has 2 Comments

BYD’s announcement last week of a 5-minute charging EV battery marks another notable milestone in the evolution of electric mobility. The company claims its new system can add 470 km of range in just five minutes, bringing EV charging times in line with conventional ICE refueling. This directly addresses one of the most common consumer concerns—charging time—and is likely to boost confidence in the transition to EVs.

But while this is an exciting development, charging speed alone won’t drive mass adoption. The real enabler will be charging infrastructure.

The good news? Solving the charging infrastructure challenge is more straightforward than it seems.

Induction charging, for example, offers a scalable solution that could integrate seamlessly into roads and parking spaces. Imagine parking spots connected to lamp posts, wirelessly charging EVs via magnetic resonance. This could be easily implemented at scale (even in Europe’s historical – and often very narrow – city streets), removing the hassle of plug-in stations. Companies like Witricity, an MIT spin-off backed by Qualcomm, Toyota, and Siemens, have already developed stationary wireless charging solutions for EVs.

While waiting for wireless charging, traditional charging networks are expanding rapidly. Between 2021 and 2024, Europe’s fast-charger networks (by major operators such as Tesla, Ionity, Allego, and Fastned) grew footprint by 7x. Tesla alone aims to increase its Supercharger network in Europe by over 60% in 2025 vs 2023, while Ionity plans to nearly triple its high-power stations. The chart below shows the physical infrastructure momentum – the direction of travel is clear.

A major issue is that charging in public spaces remains too expensive due to excessive electricity markups by Utility / Power companies. A simple regulatory fix – such as government-imposed price caps – could resolve this.

What’s then stopping the progress on EV infrastructure? In a nutshell, political short-sightness, ideology, and entrenched interests in the legacy auto and power industries.


The EV S-Curve: Exponential Demand Ahead

Once infrastructure issues are tackled, EV adoption will accelerate exponentially.

We believe EV demand will significantly surpass consensus expectations, driven by:

  • Superior technology vs. ICEs: EVs offer better performance, comfort, lower maintenance, and fewer restrictions (low-emission zones, etc.).
  • Lower total cost of ownership, even without subsidies.
  • Regulatory Support: Despite recent political pushback, policies remain broadly favorable:
    • EU: The ICE ban may shift from 2035 to 2040, but it remains in place.
    • CO2 targets for EU carmakers will now be calculated on a three-year average (2025-2027) instead of a hard 2025 target—but still, the requirement remains.
    • US: The $7,500 EV tax credit under the Inflation Reduction Act (IRA) may be scrapped under President Trump’s administration, but manufacturing subsidies are likely to remain. Even Trump’s stance is shifting—after saying in 2023 that EVs should “rot in hell,” he bought a Tesla last week.
  • Arrival of ever more affordable EVs

The writing is on the wall for ICEs (and automakers which won’t adapt). When a superior technology emerges, the old one is displaced and disappears. EVs are rapidly becoming the rational economic choice, making the long-term survival of ICEs unsustainable. Europe & the US should soon enter the fast growth phase of the S-penetration curve.


What This Means for Investors

A Silicon Valley adage states that every technological breakthrough takes twice as long as expected but half as long as we are prepared for. And the EV battery ecosystem (outside China) is certainly not ready for the coming surge in demand.

With low market expectations and potential supply constraints (as Chinese battery imports face strong restrictions in Europe and the U.S.), the battery space is primed for significant battery price increases and margin expansion, as well as an almost inevitable re-rating as growth expectations adjust.


Capturing the Opportunity via the Electric Mobility Value Niche fund

Our Electric Mobility Value Niche fund is the only active, global fund targeting the entire battery ecosystem, and also uniquely in the industry approaches the EV growth theme with a value style and a diversified approach, thus helping reduce volatility and better protect capital. The fund trades at a P/E of 8.5x and a Price to Tangible Book of 0.8x.

For details, visit: Niche AM – Electric Mobility Fund.


Follow us on LinkedIn

This is a marketing communication intended exclusively for institutional investors.

Please consult the Fund Prospectuses and KIDs before making any investment decisions.


Back Read More


123456789
Page 1 of 9

unglobalcompact fairr

Niche Asset Management ltd is authorised and regulated by the Financial Conduct Authority, FRN 783048
Legal | Cookie Policy