


When a bubble bursts, not everything bursts
The 2000 precedent justifies active management, far from the indices
On 12 June 2026, SpaceX made its Nasdaq debut in the largest IPO in history. A company with roughly USD 19 billion in revenues and a net loss of nearly USD 5 billion was priced at around USD 1,750 billion and, in its first days of trading, rose above USD 2,300 billion: roughly 120 times revenues.
Episodes like this have rekindled the fear that such euphoria signals an imminent peak in the technology cycle. Yet when someone points this out, the objection is almost always the same: “anyway, if the tech bubble bursts, everything collapses”.
This assumption is wrong.
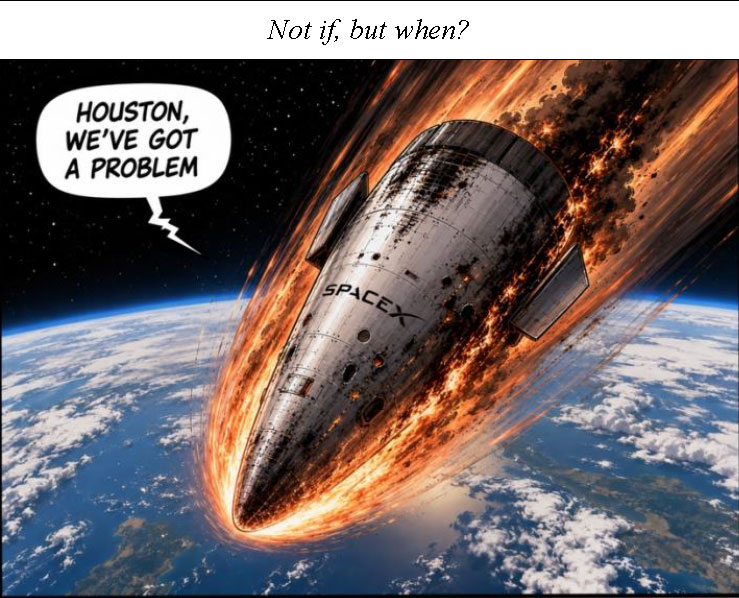
The objection implicitly has 2008 in mind. But 2008 was a bubble at the very heart of the financial system — in bank credit and leverage: a systemic and liquidity crisis. That is why, when it burst, correlations went to 1 and almost everything fell together. Today’s bubble is of a different nature: it lives within a sector, not in the financial foundations of the system.
There is a reason 2008 comes to mind first. Kahneman and Tversky called it the availability heuristic: we judge the probability of an event by the ease with which we recall an example of it, and the most recent and vivid examples are the most available. 2008 — systemic, traumatic, lived through on the markets — occupies that space; 2000 is more distant and more faded.
To this is added a demographic fact: a large share of those who today manage or advise on portfolios did not live through 2000 first-hand — they were at school or university — whereas they experienced 2008 at the start of their careers. The precedent that matters is also the one missing from the professional memory of much of the industry.
But it is the wrong precedent. Today’s bubble is concentrated on a single theme — technology, and AI in particular — within an otherwise solid financial system. It resembles 2000 far more than 2008.
And 2000 tells a different story. The burst was concentrated on technology and telecoms; capital rotated from the “new economy” towards the “old economy” — value, defensives, cyclicals. Correlations between sectors stayed low and several segments rose while the Nasdaq collapsed.
If 2000 is the relevant precedent, what matters is not how far the index will fall when the current bubble deflates, but how the sectors and styles that have nothing to do with that theme will behave.
In the period immediately following the Nasdaq’s 2000 highs — the first twelve months of the bubble’s deflation1 — not all sectors collapsed: some, in fact, rose, offering investors generous returns.
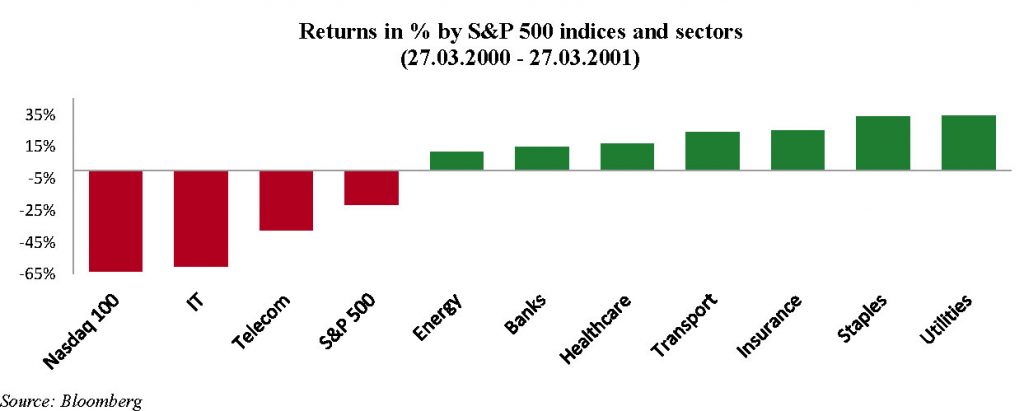
United States. In the twelve months from the peak, the Nasdaq-100 lost 63% and the S&P 500 22%, dragged down by technology (−60%) and telecommunications (−37%). But outside the bubble the picture reverses: utilities and consumer staples gained almost 35%, insurance almost 25%, transport 24%, healthcare 17%, banks and energy over 10%. A portfolio built on these segments would have closed the year strongly in the black.
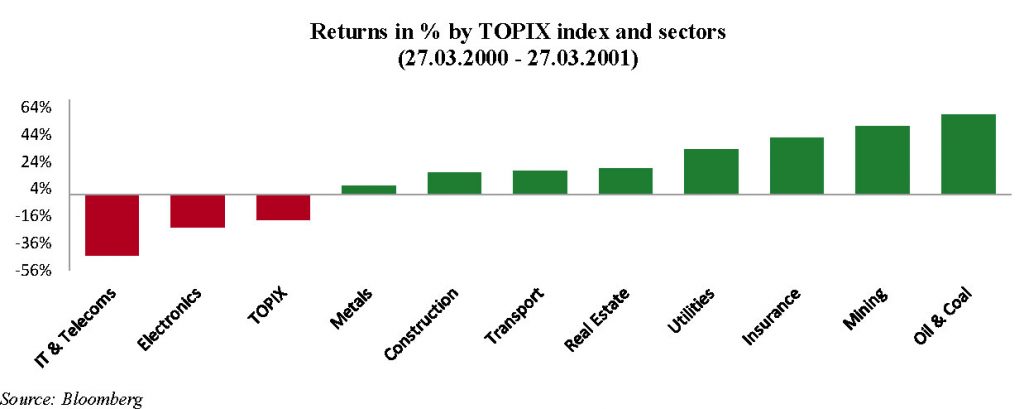
Japan. The same story, even more extreme. The TOPIX lost 19%, with electronics at −24% and IT & Telecom at −45%. But the rest of the market tells a different tale: oil & coal (+59%), mining (+50%), insurance (+42%), utilities (+33%), real estate and land transport above 17%. The rotation was even more pronounced than in the United States.
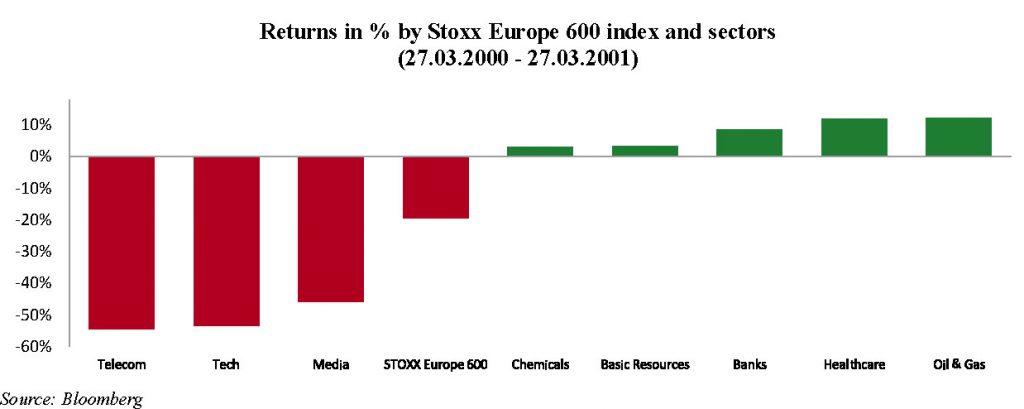
Europe. The same dynamic is found here too. The Stoxx Europe 600 lost 20%, dragged down by technology (−54%), telecommunications (−54%) and media (−46%). But outside the bubble the picture changes: oil & gas and healthcare both gained around 12%, banks over 8%, while basic resources and chemicals closed in positive territory. The gains were more modest than in the United States and Japan, but the separation between technology growth and everything else was just as clear-cut.
Utilities, pharmaceuticals, staples and the other sectors rose because they offered stable dividends, predictable cash flows, attractive valuations and low correlation with the technology cycle. In a flight to safety, the capital leaving the “new economy” sought refuge in what was tangible and profitable — real earnings, not promises of earnings or of eternal, exponential earnings growth. The same dynamic could repeat itself when stocks like SpaceX or the Mag 7 return from the stratosphere towards Earth.
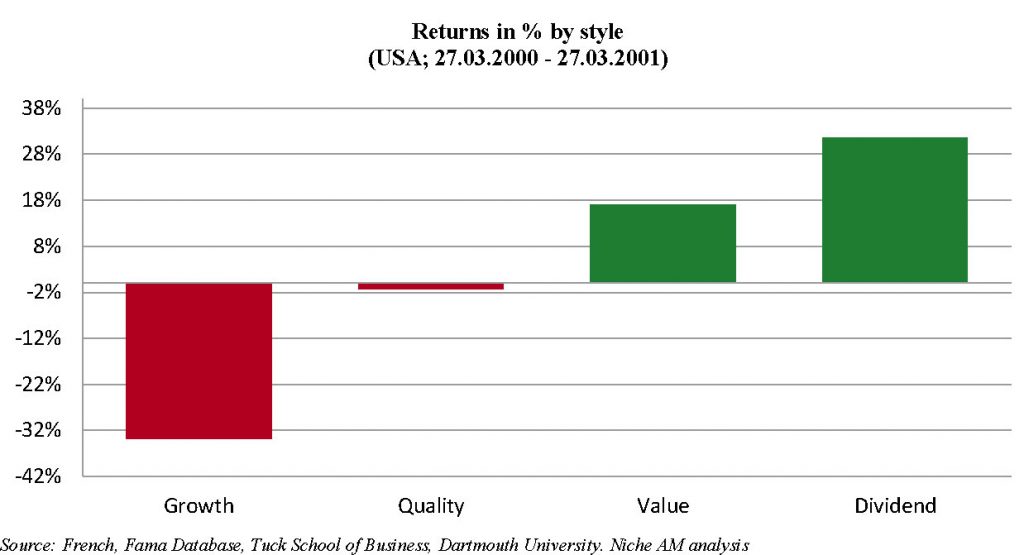
It is not only a story of sectors, but also of styles. Using the Fama-French factor portfolios, in the twelve months from the 2000 peak growth collapsed by 34%, while value gained 17% and high-dividend stocks 32%. Quality held up, at −1%
Index ≠ portafoglio
It is true that today’s main indices are extremely concentrated in Technology. In the S&P 500, Technology alone carries a weight of around 34% — at all-time highs — and together with Communication Services (which since 2018 has gathered the former telecoms alongside giants such as Alphabet, Meta and Netflix) approaches 44%. In the Nasdaq 100, Technology weighs around 57% and, with Communication Services, exceeds 70%. In the MSCI Emerging Markets, technology approaches 45%.
The bursting of the Technology bubble would therefore also pull the indices down heavily. But the indices are not the market — and, above all, they should not be investors’ portfolios. Especially today, with indices showing such extreme levels of concentration.
The central question, then, should not be “how far will the index fall”, but “how far will the portfolio fall”. They are the same thing only if the portfolio replicates the index. In the 2000 bubble, an active allocation built by sectors and stocks — underweighting the segments at extreme valuations and favouring defensives, value and less crowded exposures — would have come through the downturn with far smaller losses, in several cases closing in profit.
The cost of indexation is not only the potential depth of the fall, but its duration. The stocks at the centre of the euphoria, when the bubble bursts, can take a decade or two to revisit their highs — assuming they revisit them at all. The Nasdaq Composite returned to its March 2000 levels only in 2015, fifteen years later; many of the protagonists of that era took just as long, or never recovered. Those who stay anchored to the concentrated index do not merely suffer its decline: they wait years for its recovery.
The “everything collapses” assumption is not only wrong: it is also a cause of inertia. If everything really did fall, seeking alternatives would make no sense — one might as well endure the decline. And this inertia would be the most insidious consequence. It encourages not moving the portfolio, not underweighting the most expensive segments, not seeking the exposures that have nothing to do with the technology theme. But 2000 shows that those alternatives exist — and that they must be sought, because by replicating the index one does not find them.
The consequences of a bursting of today’s Tech bubble probably would not stop at the equity markets. If and when the bubble deflates, the macro backdrop could prove more severe than in 2000, because technology’s weight on the economy and on the indices is today far greater. To the loss of financial wealth — the “paper money” that evaporates from the markets — would clearly be added a slowdown in the enormous AI investments, with a recession likely. But, again, not everything would fall: the decline in interest rates that would accompany that slowdown would support other segments, starting with real estate. This is a further reason why a portfolio built by sectors, and not flattened onto the index, retains more ways out.
Conclusion
History never repeats itself, but it often rhymes — Mark Twain supposedly said. And indeed we are not claiming that, as the current euphoria deflates, the following twelve months will exactly retrace those that followed March 2000…but perhaps they will follow a similar rhyme. And the rhyme is in fact already visible — extreme index concentration, enthusiasm over a technology, valuations disconnected from revenues.
A single precedent, of course, is not a statistical basis, and one episode does not guarantee that the scenario will repeat. We do not present it as a forecast, but as proof that the “everything falls” assumption is not a law: the choice to select sectors and styles rests on reasons of valuation and genuine diversification, valid regardless of whether the 2000 play-book repeats.
Finally, let us be clear that we are not calling the top of the technology sector, nor the apex of the speculative bubble: we never do market timing. We are only saying that, should this euphoria deflate — in a nearer or more distant future — not everything will necessarily fall. Some sectors will hold up, and in several cases will rise. It is precisely these that genuinely active management, far from the indices, can seek out and identify: not necessarily the same ones that did well in 2000-2001, perhaps others, but only those who do not replicate the index will be able to find them.
1We deliberately measure only the 12-month window from the Nasdaq’s 2000 highs (from 27 March 2000 to 27 March 2001). This is a precise methodological choice: the 11 September 2001 attacks and the Enron scandal (late 2001) are exogenous shocks, independent of the bubble, and fall outside this window. The US recession (which began, according to the NBER, in March 2001) was instead partly an effect of that same deflation: we keep it outside the twelve months not because it is unrelated, but to isolate the sector rotation before its broader macro effects propagated.
This is a marketing communication intended exclusively for institutional investors. Please refer to the Funds’ Prospectuses and the KIDs before making any investment decision.
Like our Niche Insights? Read more here
Follow us on LinkedIn
Niche Asset Management Limited
Authorized and Regulated by the Financial Conduct Authority
17 Lennox Garden London SW1X 0DB – Registered in England – No. 10805355
Back

